
Page 121 - Human Inspired Dexterity in Robotic Manipulation
P. 121
Hand Design—Hybrid Soft and Hard Structures 119
10
Pressure at no-contact
9 15kPa
10kPa
8 5kPa
7 Gel layer Silicon layer
Force [N] 6 5 4
3 Contact with the silicon layer
2
1
0
0 1 2 3 4 5 6 7 8 9 10
Deformation [mm]
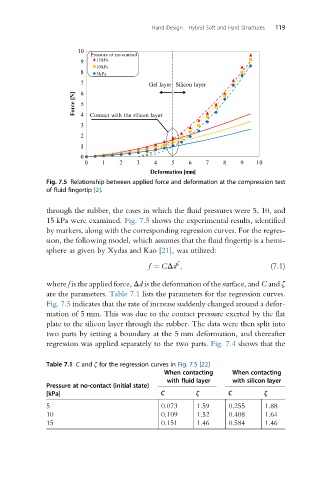
Fig. 7.5 Relationship between applied force and deformation at the compression test
of fluid fingertip [2].
through the rubber, the cases in which the fluid pressures were 5, 10, and
15 kPa were examined. Fig. 7.5 shows the experimental results, identified
by markers, along with the corresponding regression curves. For the regres-
sion, the following model, which assumes that the fluid fingertip is a hemi-
sphere as given by Xydas and Kao [21], was utilized:
ζ
f ¼ CΔd , (7.1)
where f is the applied force, Δd is the deformation of the surface, and C and ζ
are the parameters. Table 7.1 lists the parameters for the regression curves.
Fig. 7.5 indicates that the rate of increase suddenly changed around a defor-
mation of 5 mm. This was due to the contact pressure exerted by the flat
plate to the silicon layer through the rubber. The data were then split into
two parts by setting a boundary at the 5 mm deformation, and thereafter
regression was applied separately to the two parts. Fig. 7.4 shows that the
Table 7.1 C and ζ for the regression curves in Fig. 7.5 [22]
When contacting When contacting
with fluid layer with silicon layer
Pressure at no-contact (initial state)
[kPa] C ζ C ζ
5 0.073 1.59 0.255 1.88
10 0.109 1.52 0.408 1.64
15 0.151 1.46 0.584 1.46