
Page 56 - Hydrocarbon
P. 56
Exploration 43
Lines
1000 1160 1320 1480 1640 1800 1960 2120 2280 2440
1960 1960
1800 1800
1640 1640
Crosslines 1480 1480 Crosslines
0.24 0.50
1320 0.22 0.48 1320
0.20 0.46
0.18 0.44
DIP Display 0.16 0.42
0.14 0.40
0.12 0.38
1160 0.10 0.36 1160
0 5km 0.08 0.34
0.06
0.32
0.04 0.30
0.02 0.28
0.00 0.26
1000 1000
1000 1160 1320 1480 1640 1800 1960 2120 2280 2440
Lines
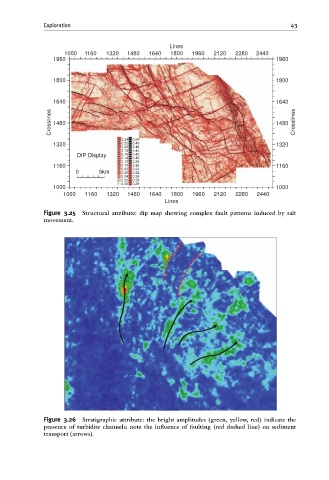
Figure 3.25 Structural attribute: dip map showing complex fault patterns induced by salt
movement.
Figure 3.26 Stratigraphic attribute: the bright amplitudes (green, yellow, red) indicate the
presence of turbidite channels; note the in£uence of faulting (red dashed line) on sediment
transport (arrows).