
Page 55 - Hydrocarbon
P. 55
42 Exploration Methods and Techniques
17100 17400 17700
N
328200
328400
328600
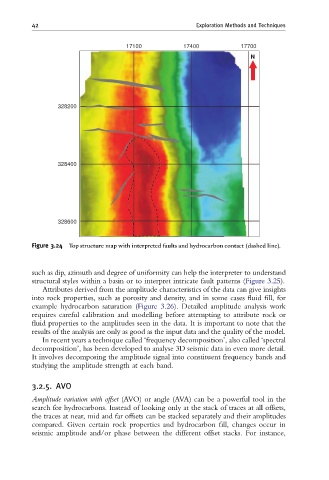
Figure 3.24 Top structure map with interpreted faults and hydrocarbon contact (dashed line).
such as dip, azimuth and degree of uniformity can help the interpreter to understand
structural styles within a basin or to interpret intricate fault patterns (Figure 3.25).
Attributes derived from the amplitude characteristics of the data can give insights
into rock properties, such as porosity and density, and in some cases fluid fill, for
example hydrocarbon saturation (Figure 3.26). Detailed amplitude analysis work
requires careful calibration and modelling before attempting to attribute rock or
fluid properties to the amplitudes seen in the data. It is important to note that the
results of the analysis are only as good as the input data and the quality of the model.
In recent years a technique called ‘frequency decomposition’, also called ‘spectral
decomposition’, has been developed to analyse 3D seismic data in even more detail.
It involves decomposing the amplitude signal into constituent frequency bands and
studying the amplitude strength at each band.
3.2.5. AVO
Amplitude variation with offset (AVO) or angle (AVA) can be a powerful tool in the
search for hydrocarbons. Instead of looking only at the stack of traces at all offsets,
the traces at near, mid and far offsets can be stacked separately and their amplitudes
compared. Given certain rock properties and hydrocarbon fill, changes occur in
seismic amplitude and/or phase between the different offset stacks. For instance,