
Page 233 - Hydrocarbon Exploration and Production Second Edition
P. 233
220 Fluid Displacement in the Reservoir
K r
1.0
K ro
K rw
0 S wc 1-S 1.0
Water Saturation (S ) or
w
Irreducible Water Saturation Residual Oil Saturation
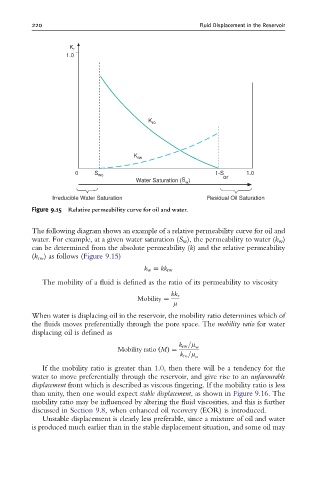
Figure 9.15 Relative permeability curve for oil and water.
The following diagram shows an example of a relative permeability curve for oil and
water. For example, at a given water saturation (S w ), the permeability to water (k w )
can be determined from the absolute permeability (k) and the relative permeability
(k rw ) as follows (Figure 9.15)
k w ¼ kk rw
The mobility of a fluid is defined as the ratio of its permeability to viscosity
kk r
Mobility ¼
m
When water is displacing oil in the reservoir, the mobility ratio determines which of
the fluids moves preferentially through the pore space. The mobility ratio for water
displacing oil is defined as
k rw =m w
Mobility ratio ðMÞ¼
k ro =m o
If the mobility ratio is greater than 1.0, then there will be a tendency for the
water to move preferentially through the reservoir, and give rise to an unfavourable
displacement front which is described as viscous fingering. If the mobility ratio is less
than unity, then one would expect stable displacement, as shown in Figure 9.16. The
mobility ratio may be influenced by altering the fluid viscosities, and this is further
discussed in Section 9.8, when enhanced oil recovery (EOR) is introduced.
Unstable displacement is clearly less preferable, since a mixture of oil and water
is produced much earlier than in the stable displacement situation, and some oil may