
Page 237 - Hydrocarbon Exploration and Production Second Edition
P. 237
224 Estimating the Production Profile
RF = E x (S - S or ) / S oi
oi
1.0
80%
Macroscopic Sweep Efficiency (E) 0.6 carbonate thin oil 60%
0.8
fractured
good
sand
40%
0.4
tight
chalks
rims
&
heavy
20%
0.2
sands
oil
10%
0.0
0.0 0.2 0.4 0.6 0.8 1.0
Microscopic Displacement Efficiency
- S ) / S
(S oi or oi
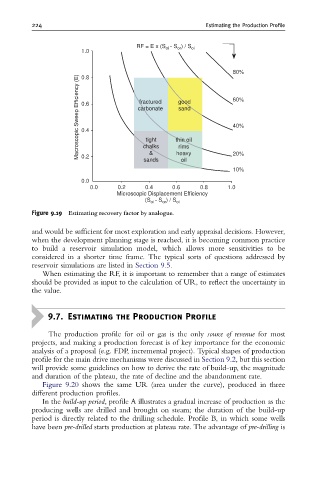
Figure 9.19 Estimating recovery factor by analogue.
and would be sufficient for most exploration and early appraisal decisions. However,
when the development planning stage is reached, it is becoming common practice
to build a reservoir simulation model, which allows more sensitivities to be
considered in a shorter time frame. The typical sorts of questions addressed by
reservoir simulations are listed in Section 9.5.
When estimating the RF, it is important to remember that a range of estimates
should be provided as input to the calculation of UR, to reflect the uncertainty in
the value.
9.7. Estimating the Production Profile
The production profile for oil or gas is the only source of revenue for most
projects, and making a production forecast is of key importance for the economic
analysis of a proposal (e.g. FDP, incremental project). Typical shapes of production
profile for the main drive mechanisms were discussed in Section 9.2, but this section
will provide some guidelines on how to derive the rate of build-up, the magnitude
and duration of the plateau, the rate of decline and the abandonment rate.
Figure 9.20 shows the same UR (area under the curve), produced in three
different production profiles.
In the build-up period, profile A illustrates a gradual increase of production as the
producing wells are drilled and brought on steam; the duration of the build-up
period is directly related to the drilling schedule. Profile B, in which some wells
have been pre-drilled starts production at plateau rate. The advantage of pre-drilling is