
Page 58 - Hydrocarbon Exploration and Production Second Edition
P. 58
Exploration 45
with increasing angle there may be an increase in amplitude in the case of a gas-
filled sand (Figure 3.27).
In order to achieve success with AVO analysis, careful modelling of rock properties
and fluid fill is required to understand the variations that occur relative to the
background trend. Furthermore, AVO is not suitable for all reservoir types and works
better in young, poorly consolidated rocks, for example West African turbidites, than
in some of the older, more cemented reservoirs encountered in the North Sea.
3.2.6. Time-lapse seismic surveys (4D seismic)
Seismic surveys can be repeated at difference times over the course of field life, for
example at regular intervals after production has started. Changes in seismic
amplitude and other attributes may occur on the post-production seismic data
(monitor survey) when compared to the original pre-production seismic data
(baseline survey). These changes are usually related to fluid movement and changes
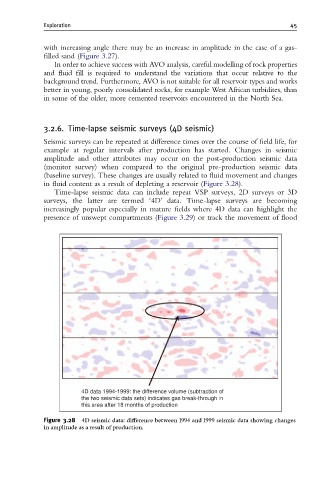
in fluid content as a result of depleting a reservoir (Figure 3.28).
Time-lapse seismic data can include repeat VSP surveys, 2D surveys or 3D
surveys, the latter are termed ‘4D’ data. Time-lapse surveys are becoming
increasingly popular especially in mature fields where 4D data can highlight the
presence of unswept compartments (Figure 3.29) or track the movement of flood
4D data 1994-1999: the difference volume (subtraction of
the two seismic data sets) indicates gas break-through in
this area after 18 months of production
Figure 3.28 4D seismic data: di¡erence between 1994 and 1999 seismic data showing changes
in amplitude as a result of production.