
Page 98 - Hydrocarbon Exploration and Production Second Edition
P. 98
Safety and the Environment 85
fire resistant coatings on structural members
computerised control and shutdown of process equipment.
In both safety and environment issues, the engineer should try to eliminate the
hazard at source. For example, one of the most hazardous operations performed in
both the offshore and onshore environments is transport, amongst which helicopter
flying has the most incidents per hour of exposure. At feasibility study stage in, say,
an offshore development, the engineer should be considering alternatives for
reducing the flying exposure of personnel. Options to consider might include
boat transport (catamaran, fast crew boat)
longer shifts (2 weeks instead of one)
minimum manned operation
unmanned operation.
Working down this list, we see more innovative approaches. The unmanned
option using computer-assisted operation (CAO) (discussed in Section 12.2,
Chapter 12) would improve safety of personnel and reduce operating cost. This is an
example of innovation and the use of technology by the engineer, and is driven by
an awareness of safety.
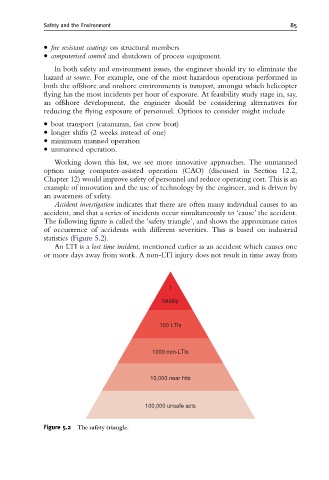
Accident investigation indicates that there are often many individual causes to an
accident, and that a series of incidents occur simultaneously to ‘cause’ the accident.
The following figure is called the ‘safety triangle’, and shows the approximate ratios
of occurrence of accidents with different severities. This is based on industrial
statistics (Figure 5.2).
An LTI is a lost time incident, mentioned earlier as an accident which causes one
or more days away from work. A non-LTI injury does not result in time away from
1
fatality
100 LTIs
1000 non-LTIs
10,000 near hits
100,000 unsafe acts
Figure 5.2 The safety triangle.