
Page 69 - Hydrogeology Principles and Practice
P. 69
HYDC02 12/5/05 5:38 PM Page 52
52 Chapter Two
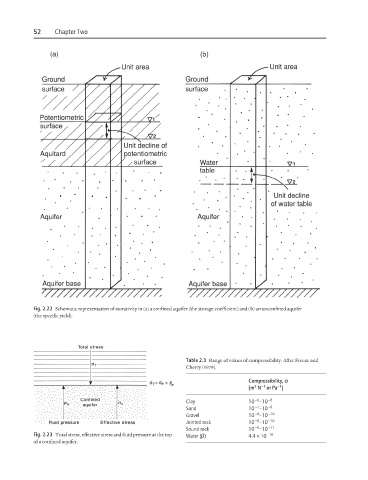
Fig. 2.22 Schematic representation of storativity in (a) a confined aquifer (the storage coefficient) and (b) an unconfined aquifer
(the specific yield).
Table 2.3 Range of values of compressibility. After Freeze and
Cherry (1979).
Compressibility, a
2
−1
−1
(m N or Pa )
−6
Clay 10 –10 −8
−7
Sand 10 –10 −9
−8
Gravel 10 –10 −10
−8
Jointed rock 10 –10 −10
−9
Sound rock 10 –10 −11
Fig. 2.23 Total stress, effective stress and fluid pressure at the top Water (b) 4.4 × 10 −10
of a confined aquifer.