
Page 46 - Illustrated Pocket Dictionary of Chromatography
P. 46
CONTROL CHART 41
sample therefore must bear a charge. No reduction or oxidation
occurs. The output is in nano- or microsiemens. Most separations that
utilize a conductivity detector are done by ion exchange, and so the
concentration and charge of the buffer affect detector noise. Higher
charge or concentration leads to higher noise. The use of a suppres-
sor column neutralizes some of the charge and lowers system noise.
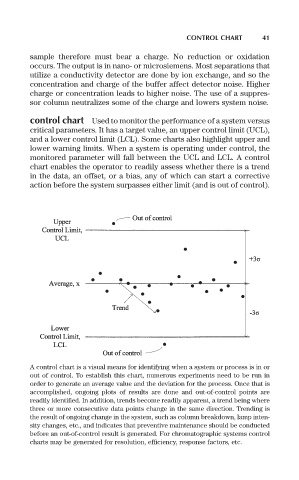
control chart Used to monitor the performance of a system versus
critical parameters. It has a target value, an upper control limit (UCL),
and a lower control limit (LCL). Some charts also highlight upper and
lower warning limits. When a system is operating under control, the
monitored parameter will fall between the UCL and LCL. A control
chart enables the operator to readily assess whether there is a trend
in the data, an offset, or a bias, any of which can start a corrective
action before the system surpasses either limit (and is out of control).
A control chart is a visual means for identifying when a system or process is in or
out of control. To establish this chart, numerous experiments need to be run in
order to generate an average value and the deviation for the process. Once that is
accomplished, ongoing plots of results are done and out-of-control points are
readily identified. In addition, trends become readily apparent, a trend being where
three or more consecutive data points change in the same direction. Trending is
the result of ongoing change in the system, such as column breakdown, lamp inten-
sity changes, etc., and indicates that preventive maintenance should be conducted
before an out-of-control result is generated. For chromatographic systems control
charts may be generated for resolution, efficiency, response factors, etc.