
Page 150 - Improving Machinery Reliability
P. 150
122 Ittprovittg Macltittery Reliability
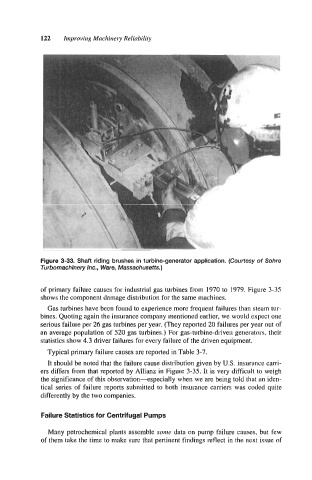
Figure 3-33. Shaft riding brushes in turbine-generator application. (Courtesy of Sohre
Turbomachinery Inc., Ware, Massachusetts.)
of primary failure causes for industrial gas turbines from 1970 to 1979. Figure 3-35
shows the component damage distribution for the same machines.
Gas turbines have been found to experience more frequent failures than steam tur-
bines. Quoting again the insurance company mentioned earlier, we would expect one
serious failure per 26 gas turbines per year. (They reported 20 failures per year out of
an average population of 520 gas turbines.) For gas-turbine-driven generators, their
statistics show 4.3 driver failures for every failure of the driven equipment.
Typical primary failure causes are reported in Table 3-7.
It should be noted that the failure cause distribution given by U.S. insurance carri-
ers differs from that reported by Allianz in Figure 3-35. It is very difficult to weigh
the significance of this observation-especially when we are being told that an iden-
tical series of failure reports submitted to both insurance carriers was coded quite
differently by the two companies.
Failure Statistics for Centrifugal Pumps
Many petrochemical plants assemble some data on pump failure causes, but few
of them take the time to make sure that pertinent findings reflect in the next issue of