
Page 148 - Improving Machinery Reliability
P. 148
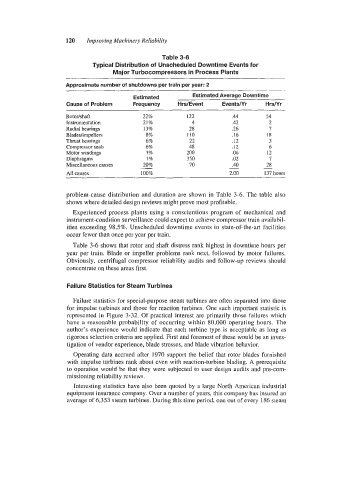
120   Improving Machinery Reliability

                                                 Table 3-6
                             Typical Distribution of  Unscheduled Downtime Events for
                                   Major Turbocompressors in Process Plants
                     Approximate number of shutdowns per train per year: 2
                                         Estimated        Estimated Average Downtime
                     Cause of Problem    Frequency    HrdEvent     EventsNr     HrsNr
                     Rotorkhaft            22%           I22          .44       54
                     Instrumentation        21%           4           .42        2
                     Radial bearings        13%          28           .26        7
                     Bladeslimpellers       8%           110          .I6       18
                     Thrust bearings        6%           22           .12        3
                     Compressor seals       6%           48           .I2        6
                     Motor windings         3%          200           .06       12
                     Diaphragms              1%         350           .02        7
                                                                                28
                     Miscellaneous causes   20%          I0           .40      -
                     All causes            100%                      2.00       I37 hours

                     problem-cause  distribution  and duration  are shown in Table 3-6. The table  also
                     shows where detailed design reviews might prove most profitable.
                       Experienced process  plants  using  a conscientious  program  of  mechanical  and
                     instrument-condition surveillance could expect to achieve compressor train availabil-
                     ities exceeding 98.5%. Unscheduled  downtime events in  state-of-the-art facilities
                     occur fewer than once per year per train.
                       Table 3-6 shows that rotor and shaft distress rank highest in downtime hours per
                     year  per  train.  Blade or impeller  problems  rank  next,  followed  by  motor  failures.
                     Obviously, centrifugal  compressor  reliability  audits  and follow-up  reviews  should
                     concentrate on these areas first.

                     Failure Statistics for Steam Turbines

                       Failure statistics for special-purpose steam turbines are often separated into those
                     for impulse turbines and those for reaction turbines. One such important statistic is
                     represented  in  Figure  3-32. Of  practical interest are primarily  those failures which
                     have a reasonable probability  of  occurring within  80,000 operating hours.  The
                     author’s  experience would  indicate  that each turbine type  is acceptable  as long as
                     rigorous selection criteria are applied. First and foremost of these would be an inves-
                     tigation of vendor experience, blade stresses, and blade vibration behavior.
                       Operating  data  accrued  after  1970 support the belief that rotor  blades furnished
                     with impulse turbines rank about even with reaction-turbine blading. A prerequisite
                     to operation would be that they were subjected to user design audits and pre-com-
                     missioning reliability reviews.
                       Interesting statistics have also been quoted by  a large North American industrial
                     equipment insurance company. Over a number of years, this company has insured an
                     average of 6,353 steam turbines. During this time period, one out of every 186 steam