
Page 291 - Improving Machinery Reliability
P. 291
262 Improving Machinery Reliability
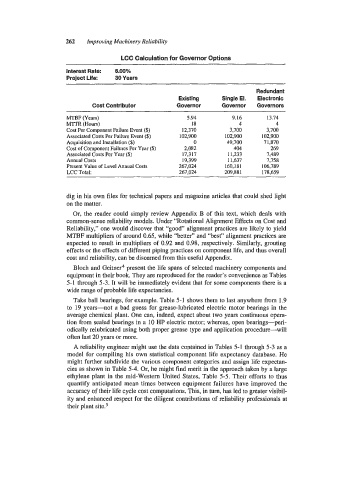
LCC Calculation for Governor Options
Interest Rate: 6.00%
Project Life: 30 Years
Redundant
Existing Single El. Electronic
Cost Contributor Governor Governor Governors
MTBF (Years) 5.94 9.16 13.74
M‘ITR (Hours) 18 4 4
Cost Per Component Failure Event ($) 12,370 3,700 3,700
Associated Costs Per Failure Event ($) 102,900 102,900 102,900
Acquisition and Installation ($) 0 49,700 7 1,870
Cost of Component Failures Per Year ($) 2,082 404 269
Associated Costs Per Year ($) 17,317 11,233 7,489
Annual Costs 19,399 11,637 7,758
Present Value of Level Annual Costs 267,024 160,18 1 106,789
LCC Total: 267.024 209.881 178,659
dig in his own files for technical papers and magazine articles that could shed light
on the matter.
Or, the reader could simply review Appendix B of this text, which deals with
common-sense reliability models. Under “Rotational Alignment Effects on Cost and
Reliability,” one would discover that “good” alignment practices are likely to yield
MTBF multipliers of around 0.65, while “better” and “best” alignment practices are
expected to result in multipliers of 0.92 and 0.98, respectively. Similarly, grouting
effects or the effects of different piping practices on component life, and thus overall
cost and reliability, can be discerned from this useful Appendix.
Bloch and Geitner4 present the life spans of selected machinery components and
equipment in their book. They are reproduced for the reader’s convenience as Tables
5-1 through 5-3. It will be immediately evident that for some components there is a
wide range of probable life expectancies.
Take ball bearings, for example. Table 5-1 shows them to last anywhere from 1.9
to 19 years-not a bad guess for grease-lubricated electric motor bearings in the
average chemical plant. One can, indeed, expect about two years continuous opera-
tion from sealed bearings in a 10 HP electric motor; whereas, open bearings-peri-
odically relubricated using both proper grease type and application procedure-will
often last 20 years or more.
A reliability engineer might use the data contained in Tables 5-1 through 5-3 as a
model for compiling his own statistical component life expectancy database. He
might further subdivide the various component categories and assign life expectan-
cies as shown in Table 5-4. Or, he might find merit in the approach taken by a large
ethylene plant in the mid-Western United States, Table 5-5. Their efforts to thus
quantify anticipated mean times between equipment failures have improved the
accuracy of their life cycle cost computations. This, in turn, has led to greater visibil-
ity and enhanced respect for the diligent contributions of reliability professionals at
their plant site.5