Page 286 - Improving Machinery Reliability
P. 286

Maintenance and Benchmarking Reliability   257

                              Maintenance Cost Vs. Replacement Asset Value:
                                Another Maintenance Spending Benchmark*
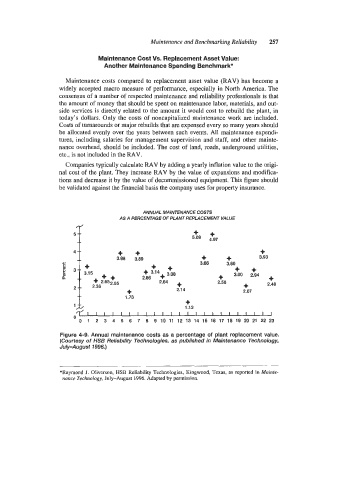
                    Maintenance  costs compared to replacement  asset value (RAV) has become  a
                   widely accepted macro measure of performance, especially in North America. The
                   consensus of a number of respected maintenance and reliability professionals is that
                   the amount of money that should be spent on maintenance labor, materials, and out-
                   side services is directly related to the amount it would cost to rebuild the plant, in
                   today’s  dollars.  Only the costs of  noncapitalized  maintenance work  are included.
                   Costs of turnarounds or major rebuilds that are expensed every so many years should
                   be allocated evenly over the years between such events. All maintenance expendi-
                   tures,  including  salaries for management  supervision and staff, and other mainte-
                   nance overhead, should be included. The cost of land, roads, underground utilities,
                   etc., is not included in the RAV.
                     Companies typically calculate RAV by adding a yearly inflation value to the origi-
                   nal cost of  the plant. They increase RAV by the value of expansions and modifica-
                   tions and decrease it by the value of decommissioned equipment. This figure should
                   be validated against the financial basis the company uses for property insurance.


                                           ANNUAL MAINTENANCE COSTS
                                     AS A PERCENTAGE OF PLANT REPLACEMENT VALUE
                                                           +   +
                                                               4.97
                                    + +                      +      +         +

                                    3.88   3.89                               3.93
                                                                       + +
                                              +    +        3.66    3.60
                                            + 3*14+ 3.08          +    3-00  2.94   +
                                           2.86
                                                2.64   +          2.56   +      2.48
                                       +              2.1 4              2.07
                                      1.73              +
                       1                                1.12
                         0  !I  5 1       !/  b  i0 : 1: 13 :4   15 16 17 18 19 20 21  22 :3
                                                                     I
                                                                I
                                                                   I
                                                              I
                                                         I
                                                                             I
                                                                               I
                                                                        I
                                                                          I
                                                   l

                   Figure 4-9. Annual  maintenance costs as a percentage  of  plant replacement  value.
                   (Courtesy of  HSB Reliability Technologies, as published in Maintenance Technology,
                   July-August  7996.)
                   *Raymond J.  OBiverson, HSB  Reliability Technologies, Kingwood, Texas,  as reported in Mainte-
                    nance Technology, July-August  1996. Adapted by permission.
   281   282   283   284   285   286   287   288   289   290   291