
Page 131 - Industrial Ventilation Design Guidebook
P. 131
4,2 STATE VALUES OF HUMID AIR; MOLLIER DIAGRAMS AND THEIR APPLICATIONS f 3
FIGURE 4.15 The mixing point in a Mollier diagram. If the supersaturated area (c) is considered,
the state of the air is driven to point 4 and (x 3 -x 4) kg H 2O/kg d.a. of water is condensed in the mixing
chamber.
so x 2 — x\. When air is heated, the state point moves up along the constant
humidity line.
Example 10
Cooling of an airflow. From Eq. (4.139) it follows that
where now 4> < 0. When air is cooled, some water can be condensed. This
depends on the surface temperature of the cooling coil, and therefore we have
m tne
the term n^-^vi equation above. From Eq. (4.140) we obtain the water
balance
so the final humidity x 2 ^ x^. The air cooling process is illustrated in Fig. 4.16.
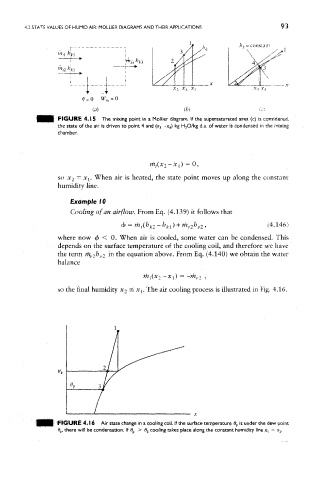
FIGURE 4.16 Air state change in a cooling coil. If the surface temperature 0 p is under the dew point
d k, there will be condensation. If #., > 6 k cooling takes place along the constant humidity line x, = x 2.