
Page 97 - Industrial Wastewater Treatment, Recycling and Reuse
P. 97
72 Industrial Wastewater Treatment, Recycling, and Reuse
In most cases, chemical industries are located far from the urban areas, and
often the effluent standards are less strict in these locales. If the land is easily
available, conventional biological processes can prove to be more econom-
ical, especially with the use of a lagoon, which offers significant cost reduc-
tion due to the simplicity of the process (less capital/land cost), less
manpower/processing costs, and ease of operation. Temperature/climate
can be a major consideration however, especially in cold regions and can
adversely affect the microbial activity and process performance.
In summary, value addition from wastewater treatment, recycling, and
reuse comes mainly from:
1. Recovery of chemicals, such as acids
2. Recovery of metals
3. Recovery of energy in the form of biogas, power
4. Recovery of water as fertilizer
5. Recovery of water as such for reuse.
Some reports have presented the cost of wastewater treatment for sewage
and for some specific industrial wastewaters such as dye wastewaters. These
include capital costs, operating costs for conventional operations such as pri-
mary treatment, UF systems, and RO. In our opinion, these calculations are
highly case and process specific and can be misleading at times, with severe
limitations from a generalization point of view. It is therefore advisable to
address the cost calculation issue from a specific separation process point
of view as a preliminary criterion for the selection of a particular method.
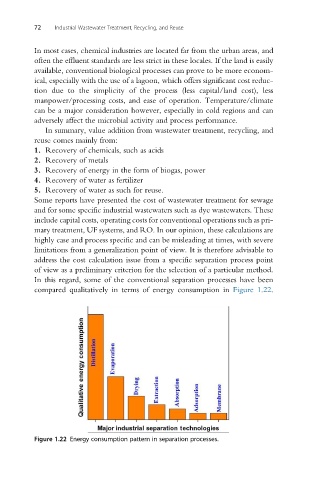
In this regard, some of the conventional separation processes have been
compared qualitatively in terms of energy consumption in Figure 1.22.
Figure 1.22 Energy consumption pattern in separation processes.