
Page 472 - Injection Molding Advanced Troubleshooting Guide
P. 472
472 47 Weld Lines
47.2 Weld Lines Troubleshooting Chart
Table 47.1 shows the weld lines troubleshooting chart.
Table 47.1 Weld Lines Troubleshooting Chart
Molding Process Mold Machine Material
fill velocity venting clamp tonnage filler type and content
melt temperature wall stock velocity to pressure viscosity
transition
second-stage pressure gate location machine performance
mold temperature
47.3 Weld Lines Troubleshooting
Weld lines can cause visual defects but can also impact the physical properties of
the molded part. Optimizing weld lines is important to the overall quality of the
product. During the design phase it is critical that everyone understands locations
where weld lines will occur. Designers must also understand that the processor
cannot change the laws of physics and that splits in the melt stream will cause
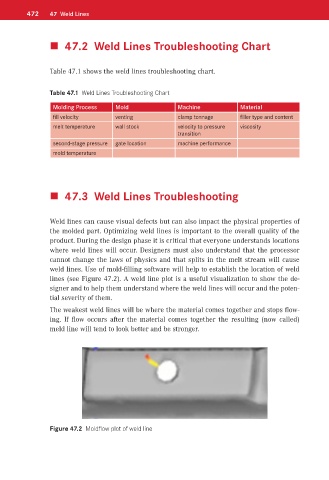
weld lines. Use of mold-filling software will help to establish the location of weld
lines (see Figure 47.2). A weld line plot is a useful visualization to show the de-
signer and to help them understand where the weld lines will occur and the poten-
tial severity of them.
The weakest weld lines will be where the material comes together and stops flow-
ing. If flow occurs after the material comes together the resulting (now called)
meld line will tend to look better and be stronger.
Figure 47.2 Moldflow plot of weld line