
Page 296 - Inorganic Mass Spectrometry - Fundamentals and Applications
P. 296
282
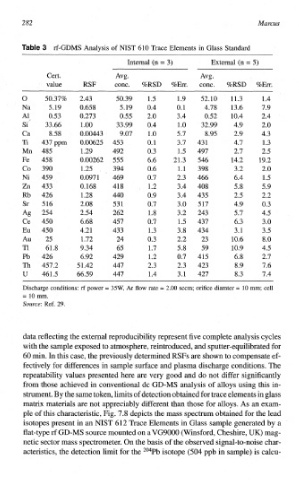
rf-GDMS Analysis of NIST 610 Trace Elements in Glass Standard
intern^ (n = 3) External (n = 5)
Cert. Avg. Avg.
value RSF conc. %RSD %Err. conc, %RSD %En.
0 50.37% 2.43 50.39 1 .5 1.9 52.10 11.3 1.4
Na 5.19 0.658 5.19 0.4 0.1 4.78 13.6 7.9
A1 0.53 0.273 0.55 2.0 3.4 0.52 10.4 2.4
Si 33-66 1 .oo 33.99 0.4 l .o 32.99 4.9 2.0
Ca 8.58 0.00443 9.07 1 .o 5.7 8.95 2.9 4.3
Ti 437 ppm 0.00625 453 0. 1 3.7 43 1 4.7 1 .3
Mn 485 1.29 492 0.3 1.5 497 2.7 2.5
Fe 458 0.00262 555 6.6 21.3 546 14.2 19.2
CO 390 1.25 394 0.6 1.1 398 3.2 2.0
Ni 459 0.097 1 469 0.7 2.3 466 6.4 1.5
Zn 433 0.168 41 8 1 .2 3.4 408 5.8 5.9
Rb 426 1 .28 440 0.9 3.4 435 2.5 2.2
Sr 5 16 2.08 53 1 0.7 3.0 517 4.9 0.3
f%2 254 2.54 262 1.8 3.2 243 5.7 4.5
Ce 450 6.68 457 0.7 1.5 437 6.3 3.0
Eu 450 4.21 433 1.3 3.8 434 3.1 3.5
Au 25 1.72 24 0.3 2.2 23 10.6 8.0
TI 61.8 9.34 65 1.7 5.8 59 10.9 4.5
Pb 426 6.92 429 1.2 0.7 415 6.8 2.7
Th 457.2 5 1.42 447 2.3 2.3 423 8.9 7.6
U 46 1 .5 66.59 447 1.4 3.1 427 8.3 7.4
Discharge conditions: rf power = 35W, Ar Aow rate = 2.00 sccm; orifice dimter = €0 mm; cell
= €0 mm.
Source: Ref. 29.
data reflecting the external reproducibility represent five complete analysis cycles
for
with the sample exposed to atmosphere, reintroduced, and sputter-equilibrated
to
60 min. In this case, the previously determined RSFs are shown compensate ef-
fectively for differences in sample surface and plasma discharge conditions. The
repeatability values presented here are very good and do not differ si~nificantly
from those achieved in conventional dc GD-MS analysis of alloys using this in-
of
strument. By the same token, limits detection obtained for trace elements in glass
matrix materials are not appreciably different than those for alloys. As an exam-
ple of this characteristic, Fig. 7.8 depicts the mass spectrum obtained for the lead
isotopes present in an NIST 612 Trace Elements in Glass sample generated by a
a
flat-type rf GD-MS source mounted on V69000 (Winsford, Cheshire, UK) mag-
netic sector mass spectrometer. On the basis of the observed signal-to-noise char-
acteristics, the detection limit for the 204Pb isotope (504 ppb in sample) is calcu-