
Page 68 - Inorganic Mass Spectrometry : Fundamentals and Applications
P. 68
lead
reason to believe that more accurately controlling the source pressure would
to improved external precision, It is not clear why the discharge pressure influ-
ences the measured isotope ratio; one possible explanation is related to the
changing discharge geometry that accompanies the pressure change.
extraction efficiency varies as a function of mass and distance from the ion exit
orifice, isotope bias may be introduced with the changing spatial relationship
between the sample and the extraction optics. This explanation has not been
verified, however; the whole phenomenon of isotopic bias is difficult to access
experimentally in nearly all fields of mass spectrometry.
The rapid development of commercial inst~mentation has meant that analyses
that were previously carried out only by thermal ionization (often with isotope
done with inductively coupled plasma mass spectrometry
. The advantages and disadvantages of each of these tech-
niques are described in various chapters in this book. One limitation of thermal
ioni~ation mass spectrometry (TIMS) and ICP-MS is the need for digestion prior
to analysis. Certain elements in difficult matrices (e.g., soils, sedimen~s, and
vegetation) often pose problems because of their low solubilities and element-
specific chemistries. In addition, the time-consuming nature of dissolution with its
inherent risks of conta~nation make the choice of performing the analysis
directly on the solid attractive. Several investigations have focused on the analysis
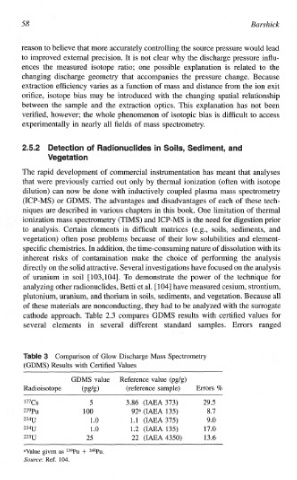
of uranium in soil [ 103,1041. To demonstrate the power of the technique for
analyzing other radionuclides, Betti et al. [ 1041 have measured cesium, strontium,
plutoniu~, uranium, and thorium in soils, sediments, and vegetation, Because all
of these materials are nonconducting, they had to be analyzed with the surrogate
cathode approach. Table 2.3 compares GDMS results with certified values for
several elements in several different standard samples. Errors ranged
of
Co~pa~son Glow Discharge Mass Spectrometry
(G~~S) Results with Certified Values
GDMS value Reference value (pg/g)
Radioisotope (pg/g) (reference sarnple) Errors %
137Cs 5 3.86 (IAEA 373) 29.5
239Pu 100 92a (IAEA 135) 8.7
234U 1 .0 1.1 (IAEA 375) 9.0
234U 1 .0 1.2 (IWA 135) 17.0
235U 25 22 (IAEA 4350) 13.6
aValue given as 239Pu + 24OPu.
Source: Ref. 104.