
Page 180 - Instrumentation Reference Book 3E
P. 180
164 Particle sizing
where a/A is the area concentration. With no
particles present in the liquid, let the values of D
and K be DO and KO. With all particles present
thoroughly mixed, let the corresponding values
be Dl and K1. At time t and depth lz, h = Vt,
where Vis the upper limit of the terminal velocity
of the particles present. If the corresponding
values of D and K are DV and Kv, the fractional
surface area of particles with terminal velocity
less than Vis given by
(2 - 2) /e - 2)
We thus have a method of measuring cumulative
surface area terminal velocity distribution. t Time t
Proprietary sedimentometers are available
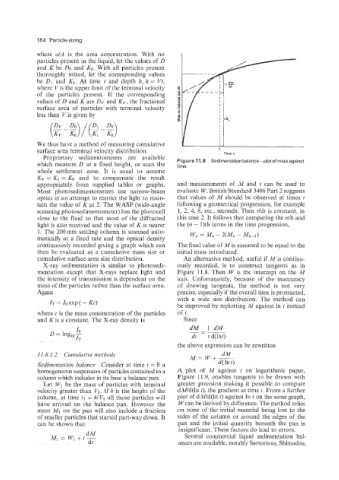
Figure 11.8 Sedimentation balance- plotofmassagainst
which measure D at a fixed height, or scan the time.
whole settlement zone. It is usual to assume
KV = K1 =KO and to compensate the result
appropriately from supplied tables or graphs. and measurements of M and t can be used to
Most photosedimentometers use narrow-beam evaluate W. British Standard 3406 Part 2 suggests
optics in an attempt to restrict the light to main- that values of M should be observed at times t
tain the value of K as 2. The WASP (wide-angle following a geometrical progression, for example
scanning photosedimentometer) has the photocell 1, 2, 4, 8, etc., seconds. Then tldf is constant, in
close to the fluid so that most of the diffracted this case 2. It follows that comparing the nth and
light is also received and the value of K is nearer the (n - 1)th terms in the time progression,
1. The 200 mm settling column is scanned auto-
matically at a fixed rate and the optical density w,, = M,, - 2(M, - Mn-1)
continuously recorded giving a graph which can The final value of M is assumed to be equal to the
then be evaluated as a cumulative mass size or initial mass introduced.
cumulative surface area size distribution. An alternative method, useful if M is continu-
X-ray sedimentation is similar to photosedi- ously recorded, is to construct tangents as in
mentation except that X-rays replace light and Figure 11.8. Then W is the intercept on the M
the intensity of transmission is dependent on the axis. Unfortunately, because of the inaccuracy
mass of the particles rather than the surface area. of drawing tangents, the method is not very
Again precise, especially if the overall time is protracted,
with a wide size distribution. The method can
IT = 1, exp ( - Kc)
be improved by replotting M against In t instead
where c is the mass concentration of the particles of t.
and K is a constant. The X-ray density is Since
dM - 1 dM
- ___
-
dt td(1nt)
the above expression can be rewritten
11.8.1.2 Cunmlative nzethods dM
M= PIT+-
Sedinzentation balance Consider at time t = 0 a d( In t)
homogeneous suspension of particles contained in a A plot of M against t on logarithmic paper,
column which includes in its base a balance pan. Figure 11.9, enables tangents to be drawn with
Let Wl be the mass of particles with terminal greater precision making it possible to compute
velocity greater than VI. If h is the height of the dM/d(ln Q, the gradient at time t. From a further
column, at time tl = h/V1 all those particles will plot of dMld(1n t) against In t on the same graph,
have arrived on the balance pan. However the Wcan be derived by difference. The method relies
mass MI on the pan will also include a fraction on none of the initial material being lost to the
of smaller particles that started part-way down. It sides of the column or around the edges of the
can be shown that pan and the initial quantity beneath the pan is
insignificant. These factors do lead to errors.
dM
MI = w, +t- Several commercial liquid sedimentation bal-
dt ances are available, notably Sartorious, Shimadzu,