
Page 203 - Materials Chemistry, Second Edition
P. 203
L1644_C05.fm Page 176 Monday, October 20, 2003 12:02 PM
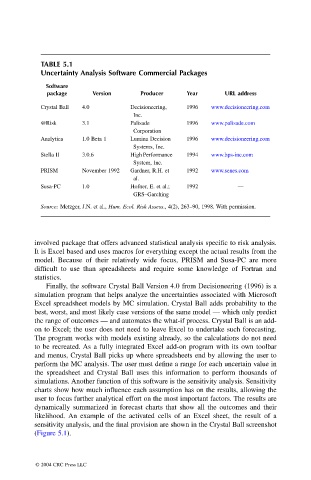
TABLE 5.1
Uncertainty Analysis Software Commercial Packages
Software
package Version Producer Year URL address
Crystal Ball 4.0 Decisioneering, 1996 www.decisioneering.com
Inc.
@Risk 3.1 Palisade 1996 www.palisade.com
Corporation
Analytica 1.0 Beta 1 Lumina Decision 1996 www.decisioneering.com
Systems, Inc.
Stella II 3.0.6 High Performance 1994 www.hps-inc.com
System, Inc.
PRISM November 1992 Gardner, R.H. et 1992 www.senes.com
al.
Susa-PC 1.0 Hofner, E. et al.; 1992 —
GRS–Garching
Source: Metzger, J.N. et al., Hum. Ecol. Risk Assess., 4(2), 263–90, 1998. With permission.
involved package that offers advanced statistical analysis specific to risk analysis.
It is Excel based and uses macros for everything except the actual results from the
model. Because of their relatively wide focus, PRISM and Susa-PC are more
difficult to use than spreadsheets and require some knowledge of Fortran and
statistics.
Finally, the software Crystal Ball Version 4.0 from Decisioneering (1996) is a
simulation program that helps analyze the uncertainties associated with Microsoft
Excel spreadsheet models by MC simulation. Crystal Ball adds probability to the
best, worst, and most likely case versions of the same model — which only predict
the range of outcomes — and automates the what-if process. Crystal Ball is an add-
on to Excel; the user does not need to leave Excel to undertake such forecasting.
The program works with models existing already, so the calculations do not need
to be recreated. As a fully integrated Excel add-on program with its own toolbar
and menus, Crystal Ball picks up where spreadsheets end by allowing the user to
perform the MC analysis. The user must define a range for each uncertain value in
the spreadsheet and Crystal Ball uses this information to perform thousands of
simulations. Another function of this software is the sensitivity analysis. Sensitivity
charts show how much influence each assumption has on the results, allowing the
user to focus further analytical effort on the most important factors. The results are
dynamically summarized in forecast charts that show all the outcomes and their
likelihood. An example of the activated cells of an Excel sheet, the result of a
sensitivity analysis, and the final provision are shown in the Crystal Ball screenshot
(Figure 5.1).
© 2004 CRC Press LLC