
Page 302 - Materials Chemistry, Second Edition
P. 302
L1644_C07.fm Page 274 Monday, October 20, 2003 12:10 PM
TABLE 7.2
Effective Stack Heights Depending on Wind Speed and Actual
Stack Height
h stack (aa aa) h eff (m)
0 to 2 m/s 2 to 3 m/s 3 to 4 m/s
5 133 60 43
100 297 195 167
200 676 435 379
Concentration [υg/m 3 ] 25
20
15
10
0 5
0 10 20 30 40 50 60 70 80 90 100
Distance from stack [km]
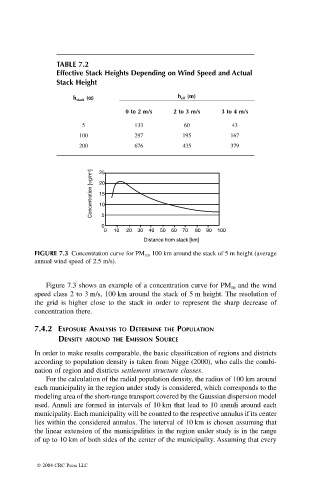
FIGURE 7.3 Concentration curve for PM 10 , 100 km around the stack of 5 m height (average
annual wind speed of 2.5 m/s).
Figure 7.3 shows an example of a concentration curve for PM and the wind
10
speed class 2 to 3 m/s, 100 km around the stack of 5 m height. The resolution of
the grid is higher close to the stack in order to represent the sharp decrease of
concentration there.
7.4.2 EXPOSURE ANALYSIS TO DETERMINE THE POPULATION
DENSITY AROUND THE EMISSION SOURCE
In order to make results comparable, the basic classification of regions and districts
according to population density is taken from Nigge (2000), who calls the combi-
nation of region and districts settlement structure classes.
For the calculation of the radial population density, the radius of 100 km around
each municipality in the region under study is considered, which corresponds to the
modeling area of the short-range transport covered by the Gaussian dispersion model
used. Annuli are formed in intervals of 10 km that lead to 10 annuli around each
municipality. Each municipality will be counted to the respective annulus if its center
lies within the considered annulus. The interval of 10 km is chosen assuming that
the linear extension of the municipalities in the region under study is in the range
of up to 10 km of both sides of the center of the municipality. Assuming that every
© 2004 CRC Press LLC