
Page 300 - Materials Chemistry, Second Edition
P. 300
L1644_C07.fm Page 272 Monday, October 20, 2003 12:10 PM
to the radius of 100 km around the stack), the program ISCST-3 (US EPA 1995),
incorporated in the software BEEST (Beeline, 1998), can be used. The calculations
for the long-range transport can be carried out using the program EcoSense (IER,
1998). Both programs are mentioned in Chapter 4 and will be applied to more cases
in Chapter 8.
For modeling the short-range exposure, only primary pollutants are considered
due to the long formation time of secondary pollutants. In order to calculate the
radial concentration, Dc (r), to derive I near , a statistical set of meteorological data
C
must be used. Because emissions occurring in a life-cycle usually cannot be assigned
to the calendar time when they happen, only mean average pollutant concentrations
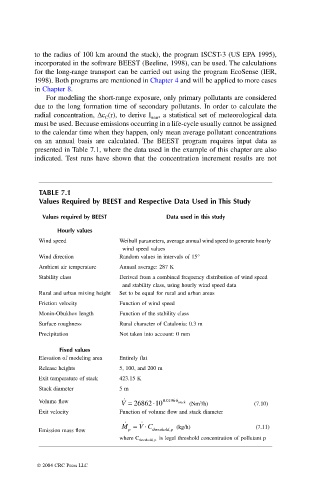
on an annual basis are calculated. The BEEST program requires input data as
presented in Table 7.1, where the data used in the example of this chapter are also
indicated. Test runs have shown that the concentration increment results are not
TABLE 7.1
Values Required by BEEST and Respective Data Used in This Study
Values required by BEEST Data used in this study
Hourly values
Wind speed Weibull parameters, average annual wind speed to generate hourly
wind speed values
Wind direction Random values in intervals of 15∞
Ambient air temperature Annual average: 287 K
Stability class Derived from a combined frequency distribution of wind speed
and stability class, using hourly wind speed data
Rural and urban mixing height Set to be equal for rural and urban areas
Friction velocity Function of wind speed
Monin-Obukhov length Function of the stability class
Surface roughness Rural character of Catalonia: 0.3 m
Precipitation Not taken into account: 0 mm
Fixed values
Elevation of modeling area Entirely flat
Release heights 5, 100, and 200 m
Exit temperature of stack 423.15 K
Stack diameter 5 m
˙
Volume flow V = 26862 ◊10 . 0 0196 ◊ h stack (Nm /h) (7.10)
3
Exit velocity Function of volume flow and stack diameter
˙
˙
M = V C◊ (kg/h) (7.11)
Emission mass flow p threshold ,p
where C threshold, p is legal threshold concentration of pollutant p
© 2004 CRC Press LLC