
Page 367 - Materials Chemistry, Second Edition
P. 367
L1644_C08.fm Page 330 Tuesday, October 21, 2003 3:03 PM
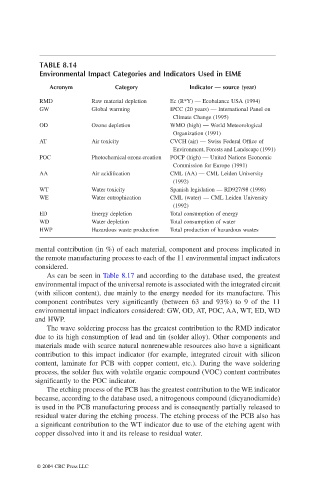
TABLE 8.14
Environmental Impact Categories and Indicators Used in EIME
Acronym Category Indicator — source (year)
RMD Raw material depletion Ec (R*Y) — Ecobalance USA (1994)
GW Global warming IPCC (20 years) — International Panel on
Climate Change (1995)
OD Ozone depletion WMO (high) — World Meteorological
Organization (1991)
AT Air toxicity CVCH (air) — Swiss Federal Office of
Environment, Forests and Landscape (1991)
POC Photochemical ozone creation POCP (high) — United Nations Economic
Commission for Europe (1991)
AA Air acidification CML (AA) — CML Leiden University
(1992)
WT Water toxicity Spanish legislation — RD927/98 (1998)
WE Water eutrophication CML (water) — CML Leiden University
(1992)
ED Energy depletion Total consumption of energy
WD Water depletion Total consumption of water
HWP Hazardous waste production Total production of hazardous wastes
mental contribution (in %) of each material, component and process implicated in
the remote manufacturing process to each of the 11 environmental impact indicators
considered.
As can be seen in Table 8.17 and according to the database used, the greatest
environmental impact of the universal remote is associated with the integrated circuit
(with silicon content), due mainly to the energy needed for its manufacture. This
component contributes very significantly (between 63 and 93%) to 9 of the 11
environmental impact indicators considered: GW, OD, AT, POC, AA, WT, ED, WD
and HWP.
The wave soldering process has the greatest contribution to the RMD indicator
due to its high consumption of lead and tin (solder alloy). Other components and
materials made with scarce natural nonrenewable resources also have a significant
contribution to this impact indicator (for example, integrated circuit with silicon
content, laminate for PCB with copper content, etc.). During the wave soldering
process, the solder flux with volatile organic compound (VOC) content contributes
significantly to the POC indicator.
The etching process of the PCB has the greatest contribution to the WE indicator
because, according to the database used, a nitrogenous compound (dicyanodiamide)
is used in the PCB manufacturing process and is consequently partially released to
residual water during the etching process. The etching process of the PCB also has
a significant contribution to the WT indicator due to use of the etching agent with
copper dissolved into it and its release to residual water.
© 2004 CRC Press LLC