
Page 370 - Materials Chemistry, Second Edition
P. 370
L1644_C08.fm Page 333 Tuesday, October 21, 2003 3:03 PM
100%
90%
80%
70%
60% Use
50% Distribution
40% Manufacturing
30%
20%
10%
0%
RMD ED WD GW OD AT POC AA WT WE HWP
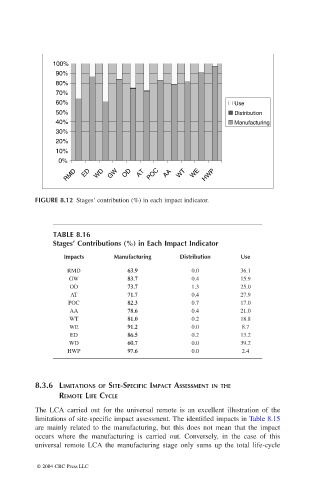
FIGURE 8.12 Stages’ contribution (%) in each impact indicator.
TABLE 8.16
Stages’ Contributions (%) in Each Impact Indicator
Impacts Manufacturing Distribution Use
RMD 63.9 0.0 36.1
GW 83.7 0.4 15.9
OD 73.7 1.3 25.0
AT 71.7 0.4 27.9
POC 82.3 0.7 17.0
AA 78.6 0.4 21.0
WT 81.0 0.2 18.8
WE 91.2 0.0 8.7
ED 86.5 0.2 13.2
WD 60.7 0.0 39.2
HWP 97.6 0.0 2.4
8.3.6 LIMITATIONS OF SITE-SPECIFIC IMPACT ASSESSMENT IN THE
REMOTE LIFE CYCLE
The LCA carried out for the universal remote is an excellent illustration of the
limitations of site-specific impact assessment. The identified impacts in Table 8.15
are mainly related to the manufacturing, but this does not mean that the impact
occurs where the manufacturing is carried out. Conversely, in the case of this
universal remote LCA the manufacturing stage only sums up the total life-cycle
© 2004 CRC Press LLC