Page 375 - Materials Chemistry, Second Edition
P. 375
L1644_C08.fm  Page 337  Tuesday, October 21, 2003  3:03 PM


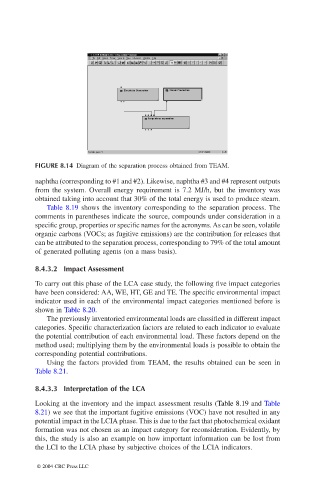
                             FIGURE 8.14 Diagram of the separation process obtained from TEAM.
                             naphtha (corresponding to #1 and #2). Likewise, naphtha #3 and #4 represent outputs
                             from the system. Overall energy requirement is 7.2 MJ/h,  but the inventory  was
                             obtained taking into account that 30% of the total energy is used to produce steam.
                                Table 8.19 shows the inventory corresponding to the separation process. The
                             comments in parentheses indicate the source, compounds under consideration in a
                             specific group, properties or specific names for the acronyms. As can be seen, volatile
                             organic carbons (VOCs; as fugitive emissions) are the contribution for releases that
                             can be attributed to the separation process, corresponding to 79% of the total amount
                             of generated polluting agents (on a mass basis).

                             8.4.3.2  Impact Assessment

                             To carry out this phase of the LCA case study, the following five impact categories
                             have been considered: AA, WE, HT, GE and TE. The specific environmental impact
                             indicator used in each of the environmental impact categories mentioned before is
                             shown in Table 8.20.
                                The previously inventoried environmental loads are classified in different impact
                             categories. Specific characterization factors are related to each indicator to evaluate
                             the potential contribution of each environmental load. These factors depend on the
                             method used; multiplying them by the environmental loads is possible to obtain the
                             corresponding potential contributions.
                                Using the  factors provided from TEAM, the results obtained can be seen in
                             Table 8.21.

                             8.4.3.3  Interpretation of the LCA
                             Looking at the inventory and the impact assessment results (Table 8.19 and Table
                             8.21) we see that the important fugitive emissions (VOC) have not resulted in any
                             potential impact in the LCIA phase. This is due to the fact that photochemical oxidant
                             formation was not chosen as an impact category for reconsideration. Evidently, by
                             this, the study is also an example on how important information can be lost from
                             the LCI to the LCIA phase by subjective choices of the LCIA indicators.

                             © 2004 CRC Press LLC

