
Page 376 - Materials Chemistry, Second Edition
P. 376
L1644_C08.fm Page 338 Tuesday, October 21, 2003 3:03 PM
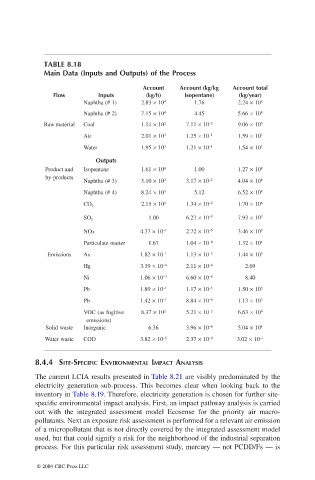
TABLE 8.18
Main Data (Inputs and Outputs) of the Process
Account Account (kg/kg Account total
Flow Inputs (kg/h) Isopentane) (kg/year)
Naphtha (# 1) 2.83 × 10 4 1.76 2.24 × 10 8
Naphtha (# 2) 7.15 × 10 4 4.45 5.66 × 10 8
Raw material Coal 1.14 × 10 2 7.11 × 10 –3 9.06 × 10 5
Air 2.01 × 10 3 1.25 × 10 –1 1.59 × 10 7
Water 1.95 × 10 3 1.21 × 10 –1 1.54 × 10 7
Outputs
Product and Isopentane 1.61 × 10 4 1.00 1.27 × 10 8
by-products
Naphtha (# 3) 5.10 × 10 2 3.17 × 10 –2 4.04 × 10 8
Naphtha (# 4) 8.24 × 10 4 5.12 6.52 × 10 8
2.15 × 10 2 1.34 × 10 –2 1.70 × 10 6
CO 2
1.00 6.23 × 10 –5 7.93 × 10 3
SO 2
NOx 4.37 × 10 –1 2.72 × 10 –5 3.46 × 10 3
Particulate matter 1.67 1.04 × 10 –4 1.32 × 10 4
Emissions As 1.82 × 10 –1 1.13 × 10 –5 1.44 × 10 3
Hg 3.39 × 10 –4 2.11 × 10 –8 2.69
Ni 1.06 × 10 –3 6.60 × 10 –8 8.40
Pb 1.89 × 10 –1 1.17 × 10 –5 1.50 × 10 3
Pb 1.42 × 10 –1 8.84 × 10 –6 1.13 × 10 3
VOC (as fugitive 8.37 × 10 2 5.21 × 10 –2 6.63 × 10 6
emissions)
Solid waste Inorganic 6.36 3.96 × 10 –4 5.04 × 10 4
Water waste COD 3.82 × 10 –5 2.37 × 10 –9 3.02 × 10 –1
8.4.4 SITE-SPECIFIC ENVIRONMENTAL IMPACT ANALYSIS
The current LCIA results presented in Table 8.21 are visibly predominated by the
electricity generation sub-process. This becomes clear when looking back to the
inventory in Table 8.19. Therefore, electricity generation is chosen for further site-
specific environmental impact analysis. First, an impact pathway analysis is carried
out with the integrated assessment model Ecosense for the priority air macro-
pollutants. Next an exposure risk assessment is performed for a relevant air emission
of a micropollutant that is not directly covered by the integrated assessment model
used, but that could signify a risk for the neighborhood of the industrial separation
process. For this particular risk assessment study, mercury — not PCDD/Fs — is
© 2004 CRC Press LLC