
Page 381 - Materials Chemistry, Second Edition
P. 381
L1644_C08.fm Page 343 Tuesday, October 21, 2003 3:03 PM
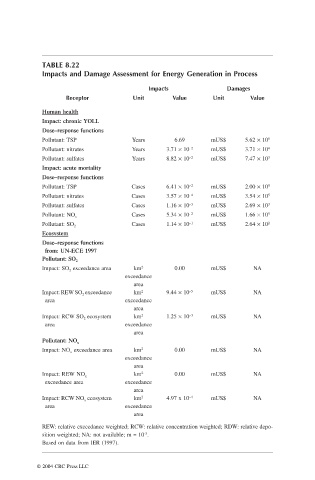
TABLE 8.22
Impacts and Damage Assessment for Energy Generation in Process
Impacts Damages
Receptor Unit Value Unit Value
Human health
Impact: chronic YOLL
Dose–response functions
Pollutant: TSP Years 6.69 mUS$ 5.62 × 10 5
Pollutant: nitrates Years 3.71 × 10 –2 mUS$ 3.71 × 10 4
Pollutant: sulfates Years 8.82 × 10 –2 mUS$ 7.47 × 10 3
Impact: acute mortality
Dose–response functions
Pollutant: TSP Cases 6.41 × 10 –2 mUS$ 2.00 × 10 5
Pollutant: nitrates Cases 3.57 × 10 –4 mUS$ 3.54 × 10 5
Pollutant: sulfates Cases 1.16 × 10 –3 mUS$ 2.69 × 10 3
Cases 5.34 × 10 –2 mUS$ 1.66 × 10 5
Pollutant: NO x
Cases 1.14 × 10 –1 mUS$ 2.64 × 10 2
Pollutant: SO 2
Ecosystem
Dose–response functions
from: UN-ECE 1997
Pollutant: SO 2
Impact: SO 2 exceedance area km 2 0.00 mUS$ NA
exceedance
area
Impact: REW SO 2 exceedance km 2 9.44 × 10 –5 mUS$ NA
area exceedance
area
Impact: RCW SO 2 ecosystem km 2 1.25 × 10 –3 mUS$ NA
area exceedance
area
Pollutant: NO x
Impact: NO x exceedance area km 2 0.00 mUS$ NA
exceedance
area
Impact: REW NO x km 2 0.00 mUS$ NA
exceedance area exceedance
area
Impact: RCW NO x ecosystem km 2 4.97 x 10 –4 mUS$ NA
area exceedance
area
REW: relative exceedance weighted; RCW: relative concentration weighted; RDW: relative depo-
-3
sition weighted; NA: not available; m = 10 .
Based on data from IER (1997).
© 2004 CRC Press LLC