
Page 71 - Materials Chemistry, Second Edition
P. 71
L1644_C02.fm Page 48 Tuesday, October 21, 2003 3:07 PM
2.4 LIFE-CYCLE INVENTORY (LCI)
2.4.1 INTRODUCTION
Within LCA, life-cycle inventory is considered the step in which all the environ-
mental loads or environmental effects generated by a product or activity during its
life-cycle are identified and evaluated. Environmental loads are defined here as the
amount of substances, radiation, noises or vibrations emitted to or removed from
the surroundings that cause potential or actual harmful effects. Within this definition
can be found: raw materials and energy consumption, air and water emissions, waste
generation, radiation, noise, vibration, odors, etc. — what is commonly known as
environmental pollution. Environmental loads must be quantifiable (valuable).
Although other types of effects such as aesthetic, social, etc. must often be taken
into account, they are not considered in LCI.
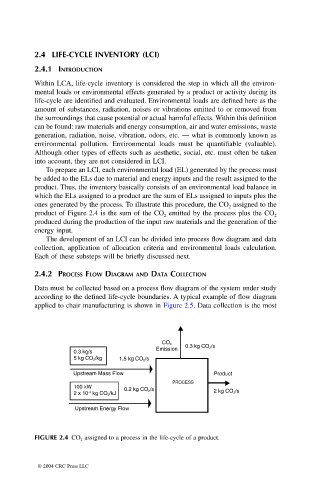
To prepare an LCI, each environmental load (EL) generated by the process must
be added to the ELs due to material and energy inputs and the result assigned to the
product. Thus, the inventory basically consists of an environmental load balance in
which the ELs assigned to a product are the sum of ELs assigned to inputs plus the
ones generated by the process. To illustrate this procedure, the CO assigned to the
2
product of Figure 2.4 is the sum of the CO emitted by the process plus the CO 2
2
produced during the production of the input raw materials and the generation of the
energy input.
The development of an LCI can be divided into process flow diagram and data
collection, application of allocation criteria and environmental loads calculation.
Each of these substeps will be briefly discussed next.
2.4.2 PROCESS FLOW DIAGRAM AND DATA COLLECTION
Data must be collected based on a process flow diagram of the system under study
according to the defined life-cycle boundaries. A typical example of flow diagram
applied to chair manufacturing is shown in Figure 2.5. Data collection is the most
CO 2
0.3 kg CO 2 /s
Emission
0.3 kg/s
5 kg CO 2 /kg 1.5 kg CO 2 /s
Upstream Mass Flow Product
PROCESS
100 kW 0.2 kg CO 2 /s
2 x 10 kg CO 2 /kJ 2 kg CO 2 /s
-4
Upstream Energy Flow
FIGURE 2.4 CO 2 assigned to a process in the life-cycle of a product.
© 2004 CRC Press LLC