
Page 83 - Materials Chemistry, Second Edition
P. 83
L1644_C02.fm Page 60 Tuesday, October 21, 2003 3:07 PM
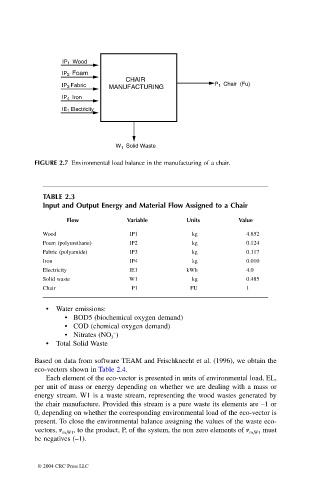
IP 1 Wood
IP 2 Foam
CHAIR
IP 3 Fabric MANUFACTURING P 1 Chair (Fu)
IP 4 Iron
IE 1 Electricity
W 1 Solid Waste
FIGURE 2.7 Environmental load balance in the manufacturing of a chair.
TABLE 2.3
Input and Output Energy and Material Flow Assigned to a Chair
Flow Variable Units Value
Wood IP1 kg 4.852
Foam (polyurethane) IP2 kg 0.124
Fabric (polyamide) IP3 kg 0.117
Iron IP4 kg 0.010
Electricity IE1 kWh 4.0
Solid waste W1 kg 0.485
Chair P1 FU 1
• Water emissions:
• BOD5 (biochemical oxygen demand)
• COD (chemical oxygen demand)
−
• Nitrates (NO )
3
• Total Solid Waste
Based on data from software TEAM and Frischknecht et al. (1996), we obtain the
eco-vectors shown in Table 2.4.
Each element of the eco-vector is presented in units of environmental load, EL,
per unit of mass or energy depending on whether we are dealing with a mass or
energy stream. W1 is a waste stream, representing the wood wastes generated by
the chair manufacture. Provided this stream is a pure waste its elements are –1 or
0, depending on whether the corresponding environmental load of the eco-vector is
present. To close the environmental balance assigning the values of the waste eco-
vectors, v , to the product, P, of the system, the non zero elements of v must
m,W1 m,W1
be negatives (–1).
© 2004 CRC Press LLC