
Page 181 - Intelligent Communication Systems
P. 181
I 52 INTELLIGENT COMMUNICATION SYSTEMS
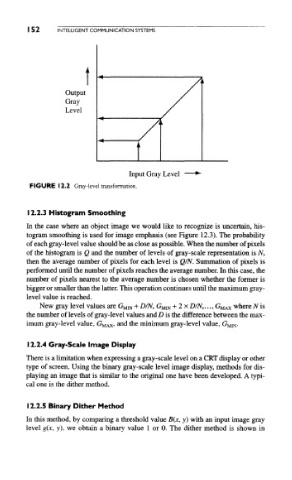
FIGURE 12.2 Gray-level transformation.
12.2.3 Histogram Smoothing
In the case where an object image we would like to recognize is uncertain, his-
togram smoothing is used for image emphasis (see Figure 12.3). The probability
of each gray-level value should be as close as possible. When the number of pixels
of the histogram is Q and the number of levels of gray-scale representation is N,
then the average number of pixels for each level is Q/N. Summation of pixels is
performed until the number of pixels reaches the average number. In this case, the
number of pixels nearest to the average number is chosen whether the former is
bigger or smaller than the latter. This operation continues until the maximum gray-
level value is reached.
New gray level values are G MIN + D/N, G MJN + 2 x D/N,..., G MAX where N is
the number of levels of gray-level values and D is the difference between the max-
imum gray-level value, G MAX, and the minimum gray-level value, G MIN.
12.2.4 Gray-Scale Image Display
There is a limitation when expressing a gray-scale level on a CRT display or other
type of screen. Using the binary gray-scale level image display, methods for dis-
playing an image that is similar to the original one have been developed. A typi-
cal one is the dither method.
12.2.5 Binary Dither Method
In this method, by comparing a threshold value B(x, y) with an input image gray
level g(x, y), we obtain a binary value 1 or 0. The dither method is shown in