
Page 132 - Intelligent Digital Oil And Gas Fields
P. 132
Data Filtering and Conditioning 97
many errors because spikes and frozen data are included in the average. Cal-
culating statistics on the corrected data, the result smooths out higher fre-
quency noise and thus provides better estimates within the summary time
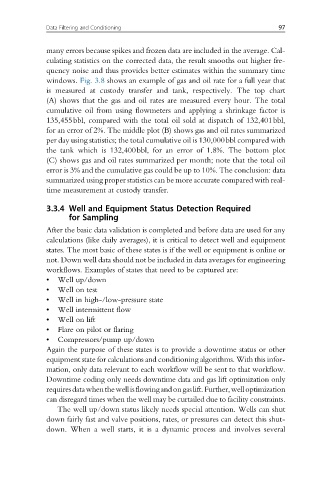
windows. Fig. 3.8 shows an example of gas and oil rate for a full year that
is measured at custody transfer and tank, respectively. The top chart
(A) shows that the gas and oil rates are measured every hour. The total
cumulative oil from using flowmeters and applying a shrinkage factor is
135,455bbl, compared with the total oil sold at dispatch of 132,401bbl,
for an error of 2%. The middle plot (B) shows gas and oil rates summarized
per day using statistics; the total cumulative oil is 130,000bbl compared with
the tank which is 132,400bbl, for an error of 1.8%. The bottom plot
(C) shows gas and oil rates summarized per month; note that the total oil
error is 3% and the cumulative gas could be up to 10%. The conclusion: data
summarized using proper statistics can be more accurate compared with real-
time measurement at custody transfer.
3.3.4 Well and Equipment Status Detection Required
for Sampling
After the basic data validation is completed and before data are used for any
calculations (like daily averages), it is critical to detect well and equipment
states. The most basic of these states is if the well or equipment is online or
not. Down well data should not be included in data averages for engineering
workflows. Examples of states that need to be captured are:
• Well up/down
• Well on test
• Well in high-/low-pressure state
• Well intermittent flow
• Well on lift
• Flare on pilot or flaring
• Compressors/pump up/down
Again the purpose of these states is to provide a downtime status or other
equipment state for calculations and conditioning algorithms. With this infor-
mation, only data relevant to each workflow will be sent to that workflow.
Downtime coding only needs downtime data and gas lift optimization only
requiresdatawhenthewellisflowingandongaslift.Further,welloptimization
can disregard times when the well may be curtailed due to facility constraints.
The well up/down status likely needs special attention. Wells can shut
down fairly fast and valve positions, rates, or pressures can detect this shut-
down. When a well starts, it is a dynamic process and involves several