
Page 203 - Intelligent Digital Oil And Gas Fields
P. 203
158 Intelligent Digital Oil and Gas Fields
(P), and temperature (T)—at a specified frequency. These values are auto-
matically stored and then sent to various engineering software applications.
Engineer applications. Fig. 5.5 shows the main options used by engineers:
data-driven models and physical models. Data-driven models (which were
discussed in Chapter 4) are executed using statistics, data mining, data ana-
lytics, and application of intelligent components to make decisions, with
emphasis on a more qualitative approach. To generate accurately meaningful
trends and tendencies, data-driven models need thousands to millions of data
points. Physical models, on the other hand, use physical laws and equations
that represent production processes and require only a few data points or
averages (e.g., daily or monthly data) to generate results.
5.2.4 Modeling the Decision-Making Process
An automated workflow for decision-making should be designed in the
same way as any cognitive process; that is, observe, understand (analyze),
act, and learn. Bravo et al. (2012) have shown that artificial intelligent com-
ponent can be the key to enrich the cognitive factor in workflow automa-
tion. To assure optimal asset performance, automated workflows include the
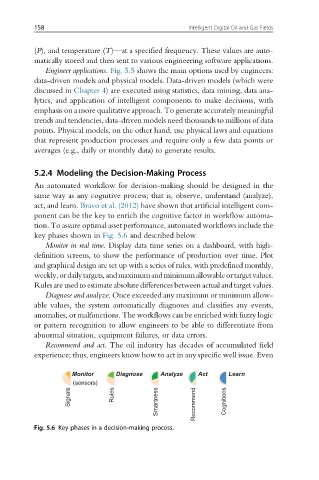
key phases shown in Fig. 5.6 and described below.
Monitor in real time. Display data time series on a dashboard, with high-
definition screens, to show the performance of production over time. Plot
and graphical design are set up with a series of rules, with predefined monthly,
weekly,ordailytargets,andmaximumandminimumallowableortargetvalues.
Rules are used to estimate absolute differences between actual and target values.
Diagnose and analyze. Once exceeded any maximum or minimum allow-
able values, the system automatically diagnoses and classifies any events,
anomalies, or malfunctions. The workflows can be enriched with fuzzy logic
or pattern recognition to allow engineers to be able to differentiate from
abnormal situation, equipment failures, or data errors.
Recommend and act. The oil industry has decades of accumulated field
experience; thus, engineers know how to act in any specific well issue. Even
Monitor Diagnose Analyze Act Learn
(sensors)
Signals Rules Smartness Recommend Cognitions
Fig. 5.6 Key phases in a decision-making process.