
Page 139 - Intermediate Statistics for Dummies
P. 139
11_045206 ch06.qxd 2/1/07 9:52 AM Page 118
118
Part II: Making Predictions by Using Regression
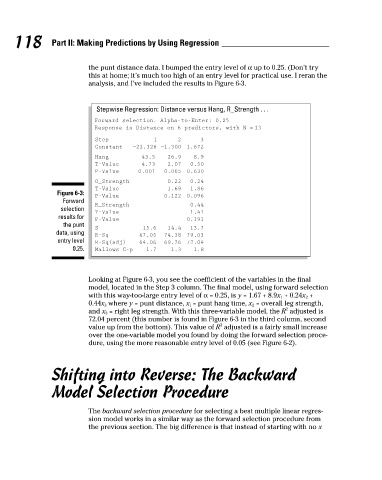
this at home; it’s much too high of an entry level for practical use. I reran the
analysis, and I’ve included the results in Figure 6-3.
Stepwise Regression: Distance versus Hang, R_Strength . . .
Forward selection. Alpha-to-Enter: 0.25
Response is Distance on 6 predictors, with N = 13
1
Step
2
3
Constant −22.326 −1.300 1.672
8.9
Hang
26.9
43.5
2.07
T-Value 4.73
0.50
P-Value 0.001
0.065 0.630
O_Strength
0.22
0.24
T-Value
1.69
1.86
Figure 6-3:
P-Value
0.122 0.096
Forward the punt distance data. I bumped the entry level of α up to 0.25. (Don’t try
R_Strength 0.44
selection
T-Value 1.41
results for P-Value 0.191
the punt
S 15.6 14.4 13.7
data, using R-Sq 67.05 74.38 79.03
entry level R-Sq(adj) 64.06 69.26 72.04
0.25. Mallows C-p 1.7 1.3 1.8
Looking at Figure 6-3, you see the coefficient of the variables in the final
model, located in the Step 3 column. The final model, using forward selection
with this way-too-large entry level of α = 0.25, is y = 1.67 + 8.9x 1 + 0.24x 2 +
0.44x 3 where y = punt distance, x 1 = punt hang time, x 2 = overall leg strength,
2
and x 3 = right leg strength. With this three-variable model, the R adjusted is
72.04 percent (this number is found in Figure 6-3 in the third column, second
2
value up from the bottom). This value of R adjusted is a fairly small increase
over the one-variable model you found by doing the forward selection proce-
dure, using the more reasonable entry level of 0.05 (see Figure 6-2).
Shifting into Reverse: The Backward
Model Selection Procedure
The backward selection procedure for selecting a best multiple linear regres-
sion model works in a similar way as the forward selection procedure from
the previous section. The big difference is that instead of starting with no x