Page 142 - Intermediate Statistics for Dummies
P. 142

11_045206 ch06.qxd  2/1/07  9:52 AM  Page 121
                                          Chapter 6: One Step Forward and Two Steps Back: Regression Model Selection
                                                    at each step. Note that each type of model selection procedure can produce a
                                                    different final model, which is normal. After all, if all the techniques led you
                                                    to the same result, why bother having more than one technique?
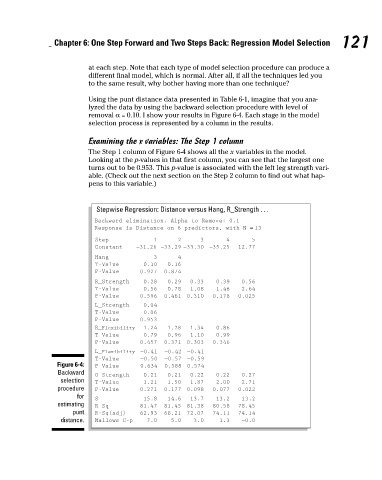
                                                    Using the punt distance data presented in Table 6-1, imagine that you ana-
                                                    lyzed the data by using the backward selection procedure with level of
                                                    removal α = 0.10. I show your results in Figure 6-4. Each stage in the model
                                                    selection process is represented by a column in the results.
                                                    Examining the x variables: The Step 1 column
                                                    The Step 1 column of Figure 6-4 shows all the x variables in the model.
                                                    Looking at the p-values in that first column, you can see that the largest one
                                                    turns out to be 0.953. This p-value is associated with the left leg strength vari-
                                                    able. (Check out the next section on the Step 2 column to find out what hap-
                                                    pens to this variable.)
                                                      Stepwise Regression: Distance versus Hang, R_Strength . . .         121
                                                     Backward elimination. Alpha-to-Remove: 0.1
                                                     Response is Distance on 6 predictors, with N = 13
                                                     Step             1     2      3      4      5
                                                     Constant    −31.26 −33.29 −33.30 −35.25  12.77
                                                     Hang             3     4
                                                     T-Value       0.10   0.16
                                                     P-Value      0.927  0.874
                                                     R_Strength    0.28   0.29  0.33   0.39   0.56
                                                     T-Value       0.56   0.78  1.08   1.46   2.64
                                                     P-Value      0.596  0.461  0.310  0.178  0.025
                                                     L_Strength    0.04
                                                     T-Value       0.06
                                                     P-Value      0.953
                                                     R_Flexibility  1.24  1.28  1.34   0.86
                                                     T-Value       0.79   0.96  1.10   0.99
                                                     P-Value      0.457  0.371 0.303  0.346
                                                     L_Flexibility −0.41  −0.42 −0.41
                                                     T-Value      −0.50  −0.57 −0.59
                                           Figure 6-4:  P-Value   0.634  0.588 0.574
                                           Backward  O_Strength    0.21   0.21  0.22   0.22   0.27
                                            selection  T-Value     1.21   1.50  1.87   2.00   2.71
                                           procedure  P-Value     0.271  0.177 0.098  0.077  0.022
                                                for  S             15.8   14.6  13.7   13.2   13.2
                                           estimating  R-Sq       81.47  81.45 81.38  80.58  78.45
                                               punt  R-Sq(adj)    62.93  68.21 72.07  74.11  74.14
                                            distance.  Mallows C-p  7.0    5.0   3.0    1.3   −0.0
   137   138   139   140   141   142   143   144   145   146   147