Page 146 - Intermediate Statistics for Dummies
P. 146

11_045206 ch06.qxd  2/1/07  9:52 AM  Page 125
                                          Chapter 6: One Step Forward and Two Steps Back: Regression Model Selection
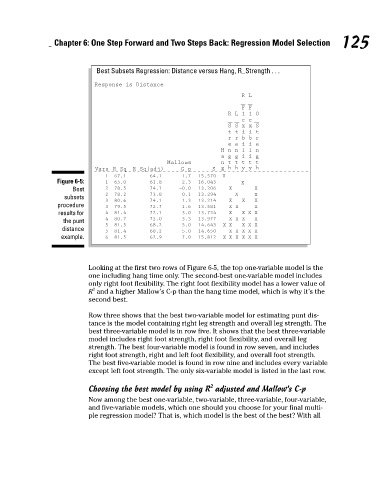
                                                      Best Subsets Regression: Distance versus Hang, R_Strength . . .
                                                                                              R L
                                                                                              F F
                                                                                          R L 1 1 O
                                                                                              e e
                                                                                          S S x x S
                                                                                          t t i i t
                                                                                          r r b b r
                                                                                          e e i i e
                                                                                        a g g i i g
                                                                                        n t t t t t
                                                                                        g h h y y h
                                                                R-Sq(adj)
                                                                             C-p
                                                     Vars R-Sq
                                                                                      S
                                                        1
                                                                                         X
                                                           67.1
                                                                     64.1
                                                                              1.7
                                           Figure 6-5:
                                                        1
                                                                              2.3
                                                                                  16.043
                                                                     61.8
                                                           65.0
                                                                                              X
                                                                     74.1
                                                                                  13.206
                                                                             −0.0
                                                           78.5
                                                                                                  X
                                                        2
                                                                                           X
                                               Best
                                                                                  13.294
                                                                                            X
                                                                     73.8
                                                           78.2
                                                                                                  X
                                                                              0.1
                                                        2
                                             subsets
                                                                     74.1
                                                                              1.3
                                                        3
                                                                                                  X
                                                                                              X
                                                                                           X
                                                           80.6
                                                                                  13.214
                                           procedure  Response is Distance  Mallows  15.570  H n n 1 1 n                  125
                                                                                           X X
                                                                                  13.581
                                                                                                  X
                                                           79.5
                                                        3
                                                                              1.6
                                                                     72.7
                                           results for  4  81.4      72.1     3.0  13.724  X  X X  X
                                             the punt   4  80.7      72.0     3.3  13.977  X X  X  X
                                                        5  81.5      68.2     5.0  14.643  X  X  X X  X
                                            distance
                                                        5  81.4      68.2     5.0  14.650  X X  X X  X
                                            example.    6  81.5      62.9     7.0  15.812  X  X X  X X  X
                                                    Looking at the first two rows of Figure 6-5, the top one-variable model is the
                                                    one including hang time only. The second-best one-variable model includes
                                                    only right foot flexibility. The right foot flexibility model has a lower value of
                                                     2
                                                    R and a higher Mallow’s C-p than the hang time model, which is why it’s the
                                                    second best.
                                                    Row three shows that the best two-variable model for estimating punt dis-
                                                    tance is the model containing right leg strength and overall leg strength. The
                                                    best three-variable model is in row five. It shows that the best three-variable
                                                    model includes right foot strength, right foot flexibility, and overall leg
                                                    strength. The best four-variable model is found in row seven, and includes
                                                    right foot strength, right and left foot flexibility, and overall foot strength.
                                                    The best five-variable model is found in row nine and includes every variable
                                                    except left foot strength. The only six-variable model is listed in the last row.
                                                                                     2
                                                    Choosing the best model by using R adjusted and Mallow’s C-p
                                                    Now among the best one-variable, two-variable, three-variable, four-variable,
                                                    and five-variable models, which one should you choose for your final multi-
                                                    ple regression model? That is, which model is the best of the best? With all
   141   142   143   144   145   146   147   148   149   150   151