Page 220 - Intermediate Statistics for Dummies
P. 220

18_045206 ch12.qxd  2/1/07  10:17 AM  Page 199
                                                              Chapter 12: Rock My World: Relating Regression to ANOVA
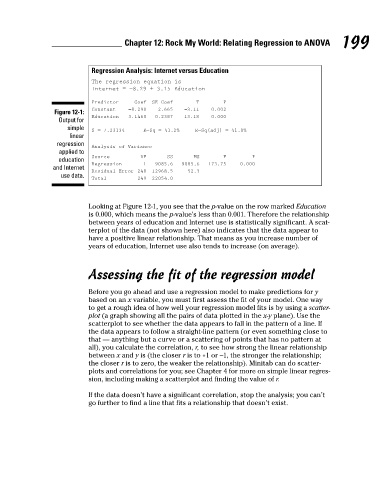
                                                    Regression Analysis: Internet versus Education
                                                    The regression equation is
                                                    Internet = −8.29 + 3.15 Education
                                                                Coef
                                                    Predictor
                                                                                  T
                                                                                         P
                                                                     SE Coef
                                                                                      0.002
                                                                              −3.11
                                                               −8.290
                                                                       2.665
                                                    Constant
                                          Figure 12-1:
                                                                      0.2387
                                                               3.1460
                                                    Education
                                                                                      0.000
                                                                              13.18
                                           Output for
                                              simple
                                                    S = 7.23134
                                                                   R—Sq = 41.2%
                                                                                 R—Sq(adj) = 41.0%
                                              linear
                                           regression
                                                    Analysis of Variance
                                           applied to
                                                                                                 P
                                                    Source
                                                                         SS
                                                                                 MS
                                                                  DF
                                                                                         F
                                           education
                                                                      9085.6
                                                                                     173.75
                                                                   1
                                                                                              0.000
                                                    Regression
                                                                             9085.6
                                          and Internet
                                                                               52.3
                                                    Residual Error 248
                                                                     12968.5
                                            use data.
                                                                     22054.0
                                                    Total
                                                                 249
                                                    Looking at Figure 12-1, you see that the p-value on the row marked Education  199
                                                    is 0.000, which means the p-value’s less than 0.001. Therefore the relationship
                                                    between years of education and Internet use is statistically significant. A scat-
                                                    terplot of the data (not shown here) also indicates that the data appear to
                                                    have a positive linear relationship. That means as you increase number of
                                                    years of education, Internet use also tends to increase (on average).
                                                    Assessing the fit of the regression model
                                                    Before you go ahead and use a regression model to make predictions for y
                                                    based on an x variable, you must first assess the fit of your model. One way
                                                    to get a rough idea of how well your regression model fits is by using a scatter-
                                                    plot (a graph showing all the pairs of data plotted in the x-y plane). Use the
                                                    scatterplot to see whether the data appears to fall in the pattern of a line. If
                                                    the data appears to follow a straight-line pattern (or even something close to
                                                    that — anything but a curve or a scattering of points that has no pattern at
                                                    all), you calculate the correlation, r, to see how strong the linear relationship
                                                    between x and y is (the closer r is to +1 or –1, the stronger the relationship;
                                                    the closer r is to zero, the weaker the relationship). Minitab can do scatter-
                                                    plots and correlations for you; see Chapter 4 for more on simple linear regres-
                                                    sion, including making a scatterplot and finding the value of r.
                                                    If the data doesn’t have a significant correlation, stop the analysis; you can’t
                                                    go further to find a line that fits a relationship that doesn’t exist.
   215   216   217   218   219   220   221   222   223   224   225