
Page 219 - Intermediate Statistics for Dummies
P. 219
18_045206 ch12.qxd 2/1/07 10:17 AM Page 198
198
Part III: Comparing Many Means with ANOVA
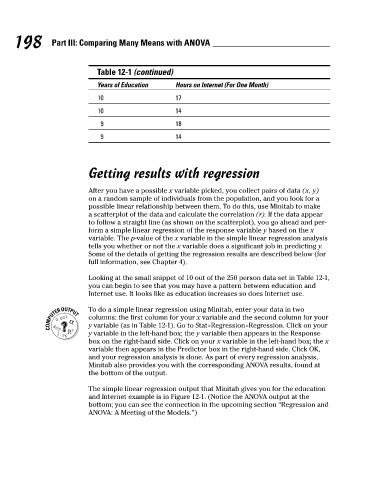
Table 12-1 (continued)
Years of Education
Hours on Internet (For One Month)
17
10
14
10
9
18
14
9
Getting results with regression
After you have a possible x variable picked, you collect pairs of data (x, y)
on a random sample of individuals from the population, and you look for a
possible linear relationship between them. To do this, use Minitab to make
a scatterplot of the data and calculate the correlation (r). If the data appear
to follow a straight line (as shown on the scatterplot), you go ahead and per-
form a simple linear regression of the response variable y based on the x
variable. The p-value of the x variable in the simple linear regression analysis
tells you whether or not the x variable does a significant job in predicting y.
Some of the details of getting the regression results are described below (for
full information, see Chapter 4).
Looking at the small snippet of 10 out of the 250 person data set in Table 12-1,
you can begin to see that you may have a pattern between education and
Internet use. It looks like as education increases so does Internet use.
To do a simple linear regression using Minitab, enter your data in two
columns: the first column for your x variable and the second column for your
y variable (as in Table 12-1). Go to Stat>Regression>Regression. Click on your
y variable in the left-hand box; the y variable then appears in the Response
box on the right-hand side. Click on your x variable in the left-hand box; the x
variable then appears in the Predictor box in the right-hand side. Click OK,
and your regression analysis is done. As part of every regression analysis,
Minitab also provides you with the corresponding ANOVA results, found at
the bottom of the output.
The simple linear regression output that Minitab gives you for the education
and Internet example is in Figure 12-1. (Notice the ANOVA output at the
bottom; you can see the connection in the upcoming section “Regression and
ANOVA: A Meeting of the Models.”)