
Page 214 - Intermediate Statistics for Dummies
P. 214
17_045206 ch11.qxd 2/1/07 10:15 AM Page 193
Chapter 11: Getting a Little Interaction with Two-Way ANOVA
Two-way ANOVA: BP versus Dosage, Times
MS
SS
Scarce
F
DF
P
28.1667
Dosage
2
56.3333
1
Times
4.1667
4.1667
16.67
0.001
2
Interaction
0.526
0.3333
0.1667
0.67
Error
18
4.5000
0.2500
65.3333
23
Total
S = 0.5
R-Sq(adj) = 91.20%
R-Sq = 93.11%
a
Two-way ANOVA: BP versus Dosage, Times
SS
DF
Source
P
F
MS
Dosage
0.0833
0.855
2
0.04167
0.16
1
Times
1.42
0.3750
0.37500
0.249
8.37500
31.74
2
16.7500
0.000
Interaction
Error
0.26389
4.7500
18
21.9583
23
Total
S = 0.5137
R-Sq(adj) = 72.36%
R-Sq = 78.37%
b
Two-way ANOVA: BP versus Dosage, Times 112.67 0.000 193
Source DF SS MS F P
Dosage 2 0.0833 0.041667 0.08 0.926
Times 1 0.3750 0.375000 0.69 0.416
Interaction 2 0.7500 0.375000 0.69 0.513
Error 18 9.7500 0.541667
Total 23 10.9583
c S = 0.7360 R-Sq = 11.03% R-Sq(adj) = 0.00%
Two-way ANOVA: BP versus Dosage, Times
Source DF SS MS F P
Dosage 2 36.7500 18.3750 47.25 0.000
Times 1 0.6667 0.6667 1.71 0.207
Interaction 2 0.0833 0.0417 0.11 0.899
Error 18 7.0000 0.3889
Total 23 44.5000
d S = 7.6236 R-Sq = 84.27% R-Sq(adj) = 79.90%
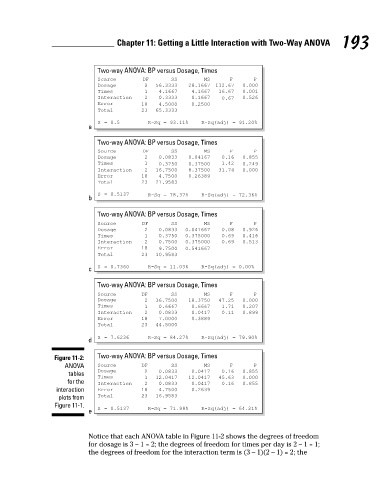
Figure 11-2: Two-way ANOVA: BP versus Dosage, Times
ANOVA Source DF SS MS F P
Dosage 2 0.0833 0.0417 0.16 0.855
tables
Times 1 12.0417 12.0417 45.63 0.000
for the Interaction 2 0.0833 0.0417 0.16 0.855
interaction Error 18 4.7500 0.2639
plots from Total 23 16.9583
Figure 11-1. S = 0.5137 R-Sq = 71.99% R-Sq(adj) = 64.21%
e
Notice that each ANOVA table in Figure 11-2 shows the degrees of freedom
for dosage is 3 – 1 = 2; the degrees of freedom for times per day is 2 – 1 = 1;
the degrees of freedom for the interaction term is (3 – 1)(2 – 1) = 2; the