
Page 231 - Intermediate Statistics for Dummies
P. 231
20_045206 ch13.qxd 2/1/07 10:21 AM Page 210
210
Part IV: Building Strong Connections with Chi-Square Tests
But you can’t stop there. You need to break down this information, calculate
some percentages, and compare them to see how close they really are. Sample
results vary from sample to sample, and differences can appear by chance.
In this chapter, you find out how to organize data from qualitative variables
(data based on categories rather than measurements) into a table format.
This skill is especially useful when you’re trying to look for relationships
between two qualitative variables, such as using a cell phone for personal
calls (a yes or no category) and gender (male or female). You also summarize
the data to answer your questions. And, finally, you get to figure out, once
and for all, what’s going on with that Simpson’s Paradox thing.
Breaking Down a Two-Way Table
A two-way table is a table that contains rows and columns, which help you
organize data from categorical (qualitative) variables in the following ways:
The rows represent the possible categories for one categorical variable,
such as males and females.
The columns represent the possible categories for a second categorical
variable, such as using your cell phone for personal calls, or not.
Here I review the basic ideas of organizing and filling in a two-way table.
Organizing data into a two-way table
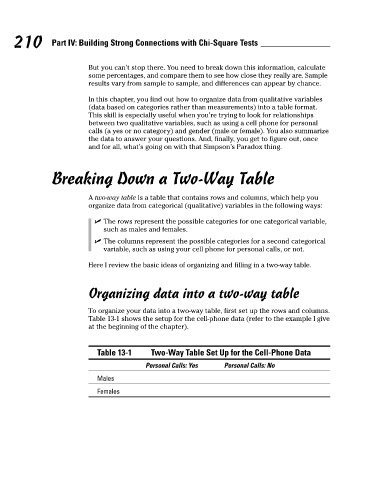
To organize your data into a two-way table, first set up the rows and columns.
Table 13-1 shows the setup for the cell-phone data (refer to the example I give
at the beginning of the chapter).
Table 13-1 Two-Way Table Set Up for the Cell-Phone Data
Personal Calls: Yes Personal Calls: No
Males
Females