
Page 138 - Intro Predictive Maintenance
P. 138
Vibration Monitoring and Analysis 129
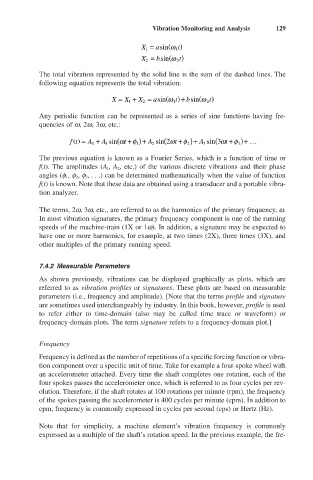
X 1 = asin (w t 1 )
b
X 2 = sin (w 2 t)
The total vibration represented by the solid line is the sum of the dashed lines. The
following equation represents the total vibration:
b
X = X + X = asin (w 1 t) + sin (w 2 t)
2
1
Any periodic function can be represented as a series of sine functions having fre-
quencies of w, 2w, 3w, etc.:
f
f
f
ft () = A + A 1 sin (w t + )+ A 2 sin (2w t + )+ A 3 sin (3w t + )+ ...
1
3
2
0
The previous equation is known as a Fourier Series, which is a function of time or
f(t). The amplitudes (A l, A 2, etc.) of the various discrete vibrations and their phase
angles (f 1, f 2, f 3, . . .) can be determined mathematically when the value of function
f(t) is known. Note that these data are obtained using a transducer and a portable vibra-
tion analyzer.
The terms, 2w, 3w, etc., are referred to as the harmonics of the primary frequency, w.
In most vibration signatures, the primary frequency component is one of the running
speeds of the machine-train (1X or 1w). In addition, a signature may be expected to
have one or more harmonics, for example, at two times (2X), three times (3X), and
other multiples of the primary running speed.
7.4.2 Measurable Parameters
As shown previously, vibrations can be displayed graphically as plots, which are
referred to as vibration profiles or signatures. These plots are based on measurable
parameters (i.e., frequency and amplitude). [Note that the terms profile and signature
are sometimes used interchangeably by industry. In this book, however, profile is used
to refer either to time-domain (also may be called time trace or waveform) or
frequency-domain plots. The term signature refers to a frequency-domain plot.]
Frequency
Frequency is defined as the number of repetitions of a specific forcing function or vibra-
tion component over a specific unit of time. Take for example a four-spoke wheel with
an accelerometer attached. Every time the shaft completes one rotation, each of the
four spokes passes the accelerometer once, which is referred to as four cycles per rev-
olution. Therefore, if the shaft rotates at 100 rotations per minute (rpm), the frequency
of the spokes passing the accelerometer is 400 cycles per minute (cpm). In addition to
cpm, frequency is commonly expressed in cycles per second (cps) or Hertz (Hz).
Note that for simplicity, a machine element’s vibration frequency is commonly
expressed as a multiple of the shaft’s rotation speed. In the previous example, the fre-