
Page 49 - Intro Predictive Maintenance
P. 49
40 An Introduction to Predictive Maintenance
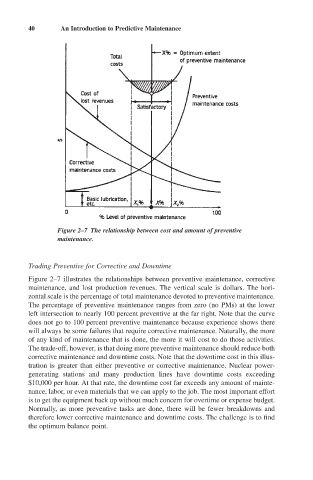
Figure 2–7 The relationship between cost and amount of preventive
maintenance.
Trading Preventive for Corrective and Downtime
Figure 2–7 illustrates the relationships between preventive maintenance, corrective
maintenance, and lost production revenues. The vertical scale is dollars. The hori-
zontal scale is the percentage of total maintenance devoted to preventive maintenance.
The percentage of preventive maintenance ranges from zero (no PMs) at the lower
left intersection to nearly 100 percent preventive at the far right. Note that the curve
does not go to 100 percent preventive maintenance because experience shows there
will always be some failures that require corrective maintenance. Naturally, the more
of any kind of maintenance that is done, the more it will cost to do those activities.
The trade-off, however, is that doing more preventive maintenance should reduce both
corrective maintenance and downtime costs. Note that the downtime cost in this illus-
tration is greater than either preventive or corrective maintenance. Nuclear power-
generating stations and many production lines have downtime costs exceeding
$10,000 per hour. At that rate, the downtime cost far exceeds any amount of mainte-
nance, labor, or even materials that we can apply to the job. The most important effort
is to get the equipment back up without much concern for overtime or expense budget.
Normally, as more preventive tasks are done, there will be fewer breakdowns and
therefore lower corrective maintenance and downtime costs. The challenge is to find
the optimum balance point.