Page 446 - Introduction to Information Optics
P. 446

Exercises


                        0 0 0 0 0 0

                        1 1 1 1 1 1

                                           7
                        2 2 2 2            ftmt 2     r*~
                        3    3 3 3 3 3

                        4 4 4 4 4 4

                        5 5 5 5 5 5


                                     Fig. 7.65.


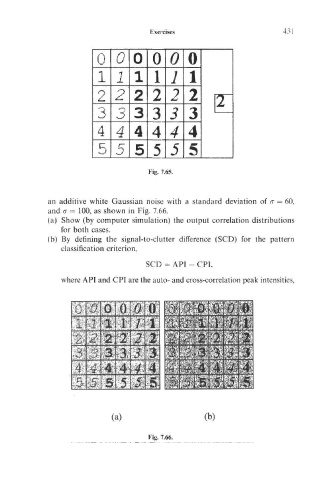
            an additive white Gaussian noise with a standard deviation of a = 60,
            and a = 100, as shown in Fig. 7.66.
            (a) Show (by computer simulation) the output correlation distributions
               for both cases.
            (b) By defining the signal-to-clutter difference (SCD) for the pattern
               classification criterion,
                                    SCD -API -CP1,
               where API and CPI are the auto- and cross-correlation peak intensities,


                            (a)                    (b)

                                     Fig. 7.66.
   441   442   443   444   445   446   447   448   449   450   451