
Page 116 - Introduction to Mineral Exploration
P. 116
5: FROM PROSPECT TO PREFEASIBILITY 99
south of the Mulberry trend. This defined two 2 Multiple of exploration spending. The value
parallel mineralized zones with encouraging of the prospect is some multiple (usually be-
assays in bedrock. Their trends were tested tween 0.5 and 3) of the amount that has been
with five holes (CMF 2,4,6–8, Fig. 5.19), which spent on the property.
demonstrated that the mineralized zones are 3 Joint venture comparison. A value is
steeply dipping veins. Although some higher assigned based on the value of a joint venture of
grade intersections were made the overall tenor the property or a similar one when the joint
did not appear to be viable, especially when venture does not involve a company associated
the mineralogy was carefully examined. Labor- with the holding company.
atory mineral processing trials of the higher 4 Replacement value. In this method the value
grade intersections failed to recover sufficient is a multiple of the cost of acquiring and main-
cassiterite to account for the total tin content taining the property, e.g. taxes and pegging
determined. It therefore seemed likely that costs, corrected for inflation.
some tin was contained in silicates, probably 5 Geoscience rating method. The value is
partly in the tin garnet, malayaite. This tin is based on a series of geological parameters such
not recoverable during conventional mineral as alteration, width, and grade of any mineral-
processing and considerably devalued these in- ized intersections and proximity to deposits
tersections. Two holes were also drilled to test using weightings. The basis for one method of
the subsurface extension of the Wheal Prosper weightings is discussed in Kilburn (1990).
pit (CMF 5) and the major copper anomaly In a practical example Ward and Lawrence
(CMF 3). Hole CMF 5 confirmed that surface (1998) compared these approaches and pre-
grades extended to depth but the grade was too ferred a comparable transaction approach. They
low to be of further interest. By contrast, CMF attempted to value a block of ground propect-
3 was more encouraging with several intersec- ive for gold in northern Ireland based on a
tions, including 1.5 m at 0.5% Sn at 95 m. proprietary database of European and global
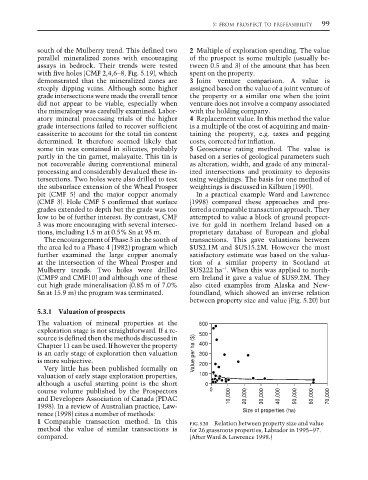
The encouragement of Phase 3 in the south of transactions. This gave valuations between
the area led to a Phase 4 (1982) program which $US2.1M and $US15.2M. However the most
further examined the large copper anomaly satisfactory estimate was based on the valua-
at the intersection of the Wheal Prosper and tion of a similar property in Scotland at
−1
Mulberry trends. Two holes were drilled $US222 ha . When this was applied to north-
(CMF9 and CMF10) and although one of these ern Ireland it gave a value of $US9.2M. They
cut high grade mineralisation (0.85 m of 7.0% also cited examples from Alaska and New-
Sn at 15.9 m) the program was terminated. foundland, which showed an inverse relation
between property size and value (Fig. 5.20) but
5.3.1 Valuation of prospects
The valuation of mineral properties at the 600
exploration stage is not straightforward. If a re- 500
source is defined then the methods discussed in
Chapter 11 can be used. If however the property 400
is an early stage of exploration then valuation Value per ha ($) 300
is more subjective. 200
Very little has been published formally on
valuation of early stage exploration properties, 100
although a useful starting point is the short 0
course volume published by the Prospectors 0
and Developers Association of Canada (PDAC 10,000 20,000 30,000 40,000 50,000 60,000 70,000
1998). In a review of Australian practice, Law-
rence (1998) cites a number of methods: Size of properties (ha)
1 Comparable transaction method. In this FIG. 5.20 Relation between property size and value
method the value of similar transactions is for 26 grassroots properties, Labrador in 1995–97.
compared. (After Ward & Lawrence 1998.)