
Page 104 - Introduction to Naval Architecture
P. 104
THE ENVIRONMENT 91
a two-dimensional system, the dimensions being frequency and direction.
Only the simpler, long crested system will be considered in this book.
For briefness it will be called an irregular wave system.
Evidence, based on both measured and visual data at a number of
widely separated locations over the North Atlantic, leaves litde doubt
that mean wave heights have increased over the past 30 years or more
4 5
at a rate of the order of about 1.5 per cent per annum. ' Indications
that extreme wave heights may also have increased slightly are noted
but the evidence for this is not conclusive. One possible cause for the
increase in the mean height is increasing storm frequency giving waves
less time to decay between storms. The fresh winds then act upon a
surface with swell already present. This increase in mean wave height
has important implications for the naval architect, particularly as in
many cases a new design is based upon comparison with existing,
successful, designs. The data given in this chapter does not allow for
this increase. With the increasing use of satellites to provide wave data
the effect should become clearer with time.
Describing an irregular wave system
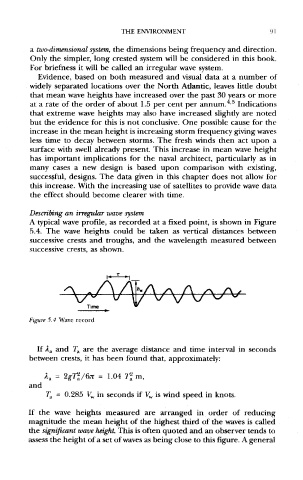
A typical wave profile, as recorded at a fixed point, is shown in Figure
5.4, The wave heights could be taken as vertical distances between
successive crests and troughs, and the wavelength measured between
successive crests, as shown.
Figure 5.4 Wave record
If A a and T & are the average distance and time interval in seconds
between crests, it has been found that, approximately:
T a = 0.285 V w in seconds if V w is wind speed in knots.
If the wave heights measured are arranged in order of reducing
magnitude the mean height of the highest third of the waves is called
the significant wave height. This is often quoted and an observer tends to
assess the height of a set of waves as being close to this figure. A general