
Page 105 - Introduction to Naval Architecture
P. 105
92 THE ENVIRONMENT
Table 5,4 Sea state code
0 Calm (glassy) 0
1 Calm (rippled) 0 to 0.10
2 Smooth (wavelets) 0.10 to 0,50
3 Slight 0.50 to 1.25
4 Moderate 1.25 to 2,50
5 Rough 2.50 to 4.00
6 Very rough 4.00 to 6.00
7 High 6.00 to 9.00
8 Very high 9.00 to 14.00
9 Phenomenal Over 14
description of a sea state, related to significant wave height is given by
the sea state code, Table 5.4, which is quite widely accepted although an
earlier code will sometimes still be encountered.
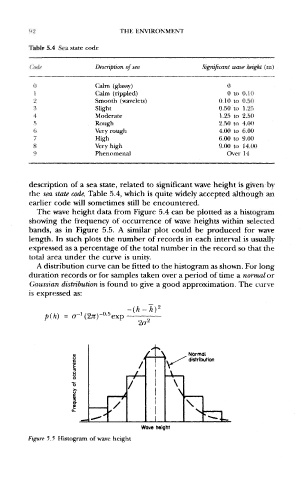
The wave height data from Figure 5.4 can be plotted as a histogram
showing the frequency of occurrence of wave heights within selected
bands, as in Figure 5.5. A similar plot could be produced for wave
length. In such plots the number of records in each interval is usually
expressed as a percentage of the total number in the record so that the
total area under the curve is unity.
A distribution curve can be fitted to the histogram as shown. For long
duration records or for samples taken over a period of time a normal or
Gaussian distribution is found to give a good approximation. The curve
is expressed as:
Figure 5.5 Histogram of wave height