
Page 243 - Introduction to Naval Architecture
P. 243
228 PROPULSION
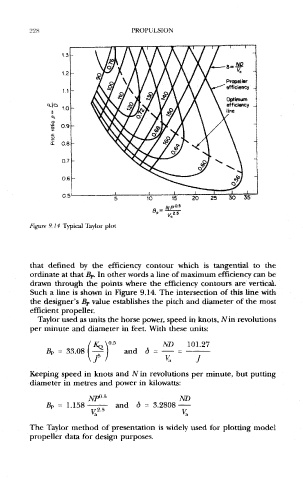
Figure 9.14 Typical Taylor plot
that defined by the efficiency contour which is tangential to the
ordinate at that Bp. In other words a line of maximum efficiency can be
drawn through the points where the efficiency contours are vertical.
Such a line is shown in Figure 9,14. The intersection of this line with
the designer's jBp value establishes the pitch and diameter of the most
efficient propeller.
Taylor used as units the horse power, speed in knots, JVin revolutions
per minute and diameter in feet. With these units:
Keeping speed in knots and N in revolutions per minute, but putting
diameter in metres and power in kilowatts:
The Taylor method of presentation is widely used for plotting model
propeller data for design purposes.