
Page 108 - Introduction to Paleobiology and The Fossil Record
P. 108
PALEOECOLOGY AND PALEOCLIMATES 95
Box 4.2 Ecological statistics and sampling sufficiency: are you getting
enough?
It is often difficult to assess the adequacy of a paleoecological sample. Some authorities have sug-
gested that samples of about 300 give a fairly accurate census of a fossil assemblage. Commonly,
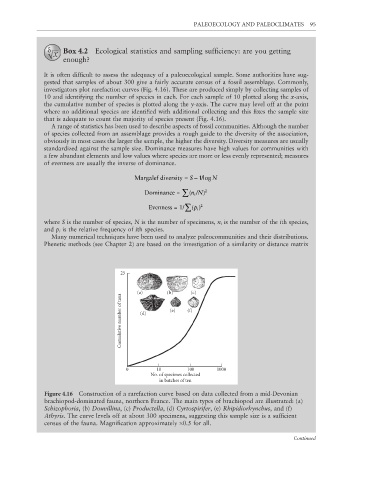
investigators plot rarefaction curves (Fig. 4.16). These are produced simply by collecting samples of
10 and identifying the number of species in each. For each sample of 10 plotted along the x-axis,
the cumulative number of species is plotted along the y-axis. The curve may level off at the point
where no additional species are identified with additional collecting and this fixes the sample size
that is adequate to count the majority of species present (Fig. 4.16).
A range of statistics has been used to describe aspects of fossil communities. Although the number
of species collected from an assemblage provides a rough guide to the diversity of the association,
obviously in most cases the larger the sample, the higher the diversity. Diversity measures are usually
standardized against the sample size. Dominance measures have high values for communities with
a few abundant elements and low values where species are more or less evenly represented; measures
of evenness are usually the inverse of dominance.
−
Margalef diversity = S 1/log N
nN
Dominance = ∑ ( / ) 2
i
Evenness = 1/ ∑ ( ) 2
p i
where S is the number of species, N is the number of specimens, n i is the number of the ith species,
and p i is the relative frequency of ith species.
Many numerical techniques have been used to analyze paleocommunities and their distributions.
Phenetic methods (see Chapter 2) are based on the investigation of a similarity or distance matrix
25
(a) (b) (c)
Cumulative number of taxa (d) (e) (f)
0 10 100 1000
No. of specimes collected
in batches of ten
Figure 4.16 Construction of a rarefaction curve based on data collected from a mid-Devonian
brachiopod-dominated fauna, northern France. The main types of brachiopod are illustrated: (a)
Schizophoria, (b) Douvillina, (c) Productella, (d) Cyrtospirifer, (e) Rhipidiorhynchus, and (f)
Athyris. The curve levels off at about 300 specimens, suggesting this sample size is a suffi cient
census of the fauna. Magnifi cation approximately ×0.5 for all.
Continued