
Page 336 - Introduction to Paleobiology and The Fossil Record
P. 336
SPIRALIANS 1: LOPHOPHORATES 323
Locality
107
76 Slope
75
64
74
59
73
Outer shelf
3
1
4
63 Inner shelf B
9
61
7
5 Inner shelf A
11
0.0 Distance 3.0
coefficient
(a)
18 Unilaminar flexible substrate Multilaminar massive Cemented cylindrical branches Cemented unilaminar branches Cemented unilaminar branches Articulated cylindrical branches Articulated unilaminar branches Rooted encrusting sheet
16 Unilaminar solid substrate Unilaminar hollow cylinder Cemented fenestrate sheet Rooted bilaminar sheet Rooted branches Rooted fenestrate sheet
14 Articulated zooids Rooted cone-disk Free-living motile
12
Scaled index 10 8 6
2 4
0
Inner shelf A Inner shelf B Outer shelf Slope
(b)
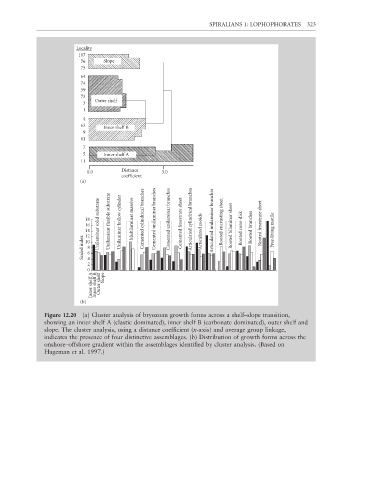
Figure 12.20 (a) Cluster analysis of bryozoan growth forms across a shelf–slope transition,
showing an inner shelf A (clastic dominated), inner shelf B (carbonate dominated), outer shelf and
slope. The cluster analysis, using a distance coeffi cient (x-axis) and average group linkage,
indicates the presence of four distinctive assemblages. (b) Distribution of growth forms across the
onshore–offshore gradient within the assemblages identified by cluster analysis. (Based on
Hageman et al. 1997.)