
Page 43 - Introduction to Paleobiology and The Fossil Record
P. 43
30 INTRODUCTION TO PALEOBIOLOGY AND THE FOSSIL RECORD
200
200 m 160
hemisphaerica intermedia curtisi sulcata angelini 40 first appearance of E. intermedia
100 m hemisphaerica intermedia curtisi sulcata angelini Section B distance from base (m)
in both sections
0 20 40 60 80 100 m
Section A Section B Section A distance from base (m)
(a)
E. sulcata E. intermedia E. angelini E. hemisphaerica E. curtisi E. angelini E. sulcata E. curtisi E. intermedia E. hemisphaerica
5 5 5
4 4 4
3 3 3
2 2 2
1 1 1
Starting matrix Seriated matrix
Sampled
horizons
(b)
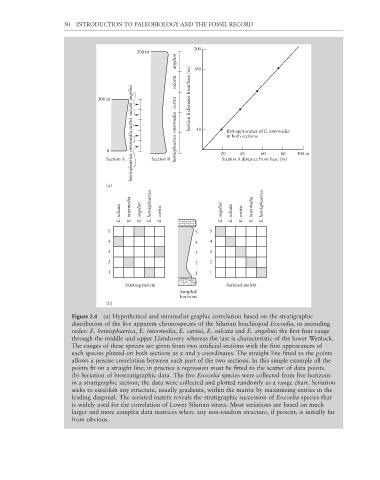
Figure 2.4 (a) Hypothetical and minimalist graphic correlation based on the stratigraphic
distribution of the five apparent chronospecies of the Silurian brachiopod Eocoelia, in ascending
order: E. hemisphaerica, E. intermedia, E. curtisi, E. sulcata and E. angelini; the fi rst four range
through the middle and upper Llandovery whereas the last is characteristic of the lower Wenlock.
The ranges of these species are given from two artificial sections with the first appearances of
each species plotted on both sections as x and y coordinates. The straight line fitted to the points
allows a precise correlation between each part of the two sections. In this simple example all the
points fit on a straight line; in practice a regression must be fitted to the scatter of data points.
(b) Seriation of biostratigraphic data. The fi ve Eocoelia species were collected from fi ve horizons
in a stratigraphic section; the data were collected and plotted randomly as a range chart. Seriation
seeks to establish any structure, usually gradients, within the matrix by maximizing entries in the
leading diagonal. The seriated matrix reveals the stratigraphic succession of Eocoelia species that
is widely used for the correlation of Lower Silurian strata. Most seriations are based on much
larger and more complex data matrices where any non-random structure, if present, is initially far
from obvious.