
Page 44 - Introduction to Paleobiology and The Fossil Record
P. 44
FOSSILS IN TIME AND SPACE 31
Section 1 Section 2 Section 3
A B C A B C A B C
RASC solution Maximal range solution
A B C A B C
(c)
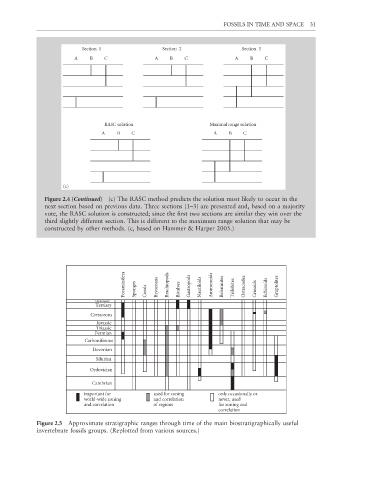
Figure 2.4 (Continued) (c) The RASC method predicts the solution most likely to occur in the
next section based on previous data. Three sections (1–3) are presented and, based on a majority
vote, the RASC solution is constructed; since the first two sections are similar they win over the
third slightly different section. This is different to the maximum range solution that may be
constructed by other methods. (c, based on Hammer & Harper 2005.)
Foraminifera Sponges Corals Bryozoans Brachiopods Bivalves Gastropods Nautiloids Ammonoids Belemnites Trilobites Ostracodes Crinoids Echinoids Graptolites
Quaternary
Tertiary
Cretaceous
Jurassic
Triassic
Permian
Carboniferous
Devonian
Silurian
Ordovician
Cambrian
important for used for zoning only occasionally or
world-wide zoning and correlation never, used
and correlation of regions for zoning and
correlation
Figure 2.5 Approximate stratigraphic ranges through time of the main biostratigraphically useful
invertebrate fossils groups. (Replotted from various sources.)